Ionomic Differences between Susceptible and Resistant Olive Cultivars Infected by Xylella fastidiosa in the Outbreak Area of Salento, Italy

 , , , and
Abstract
:1. Introduction
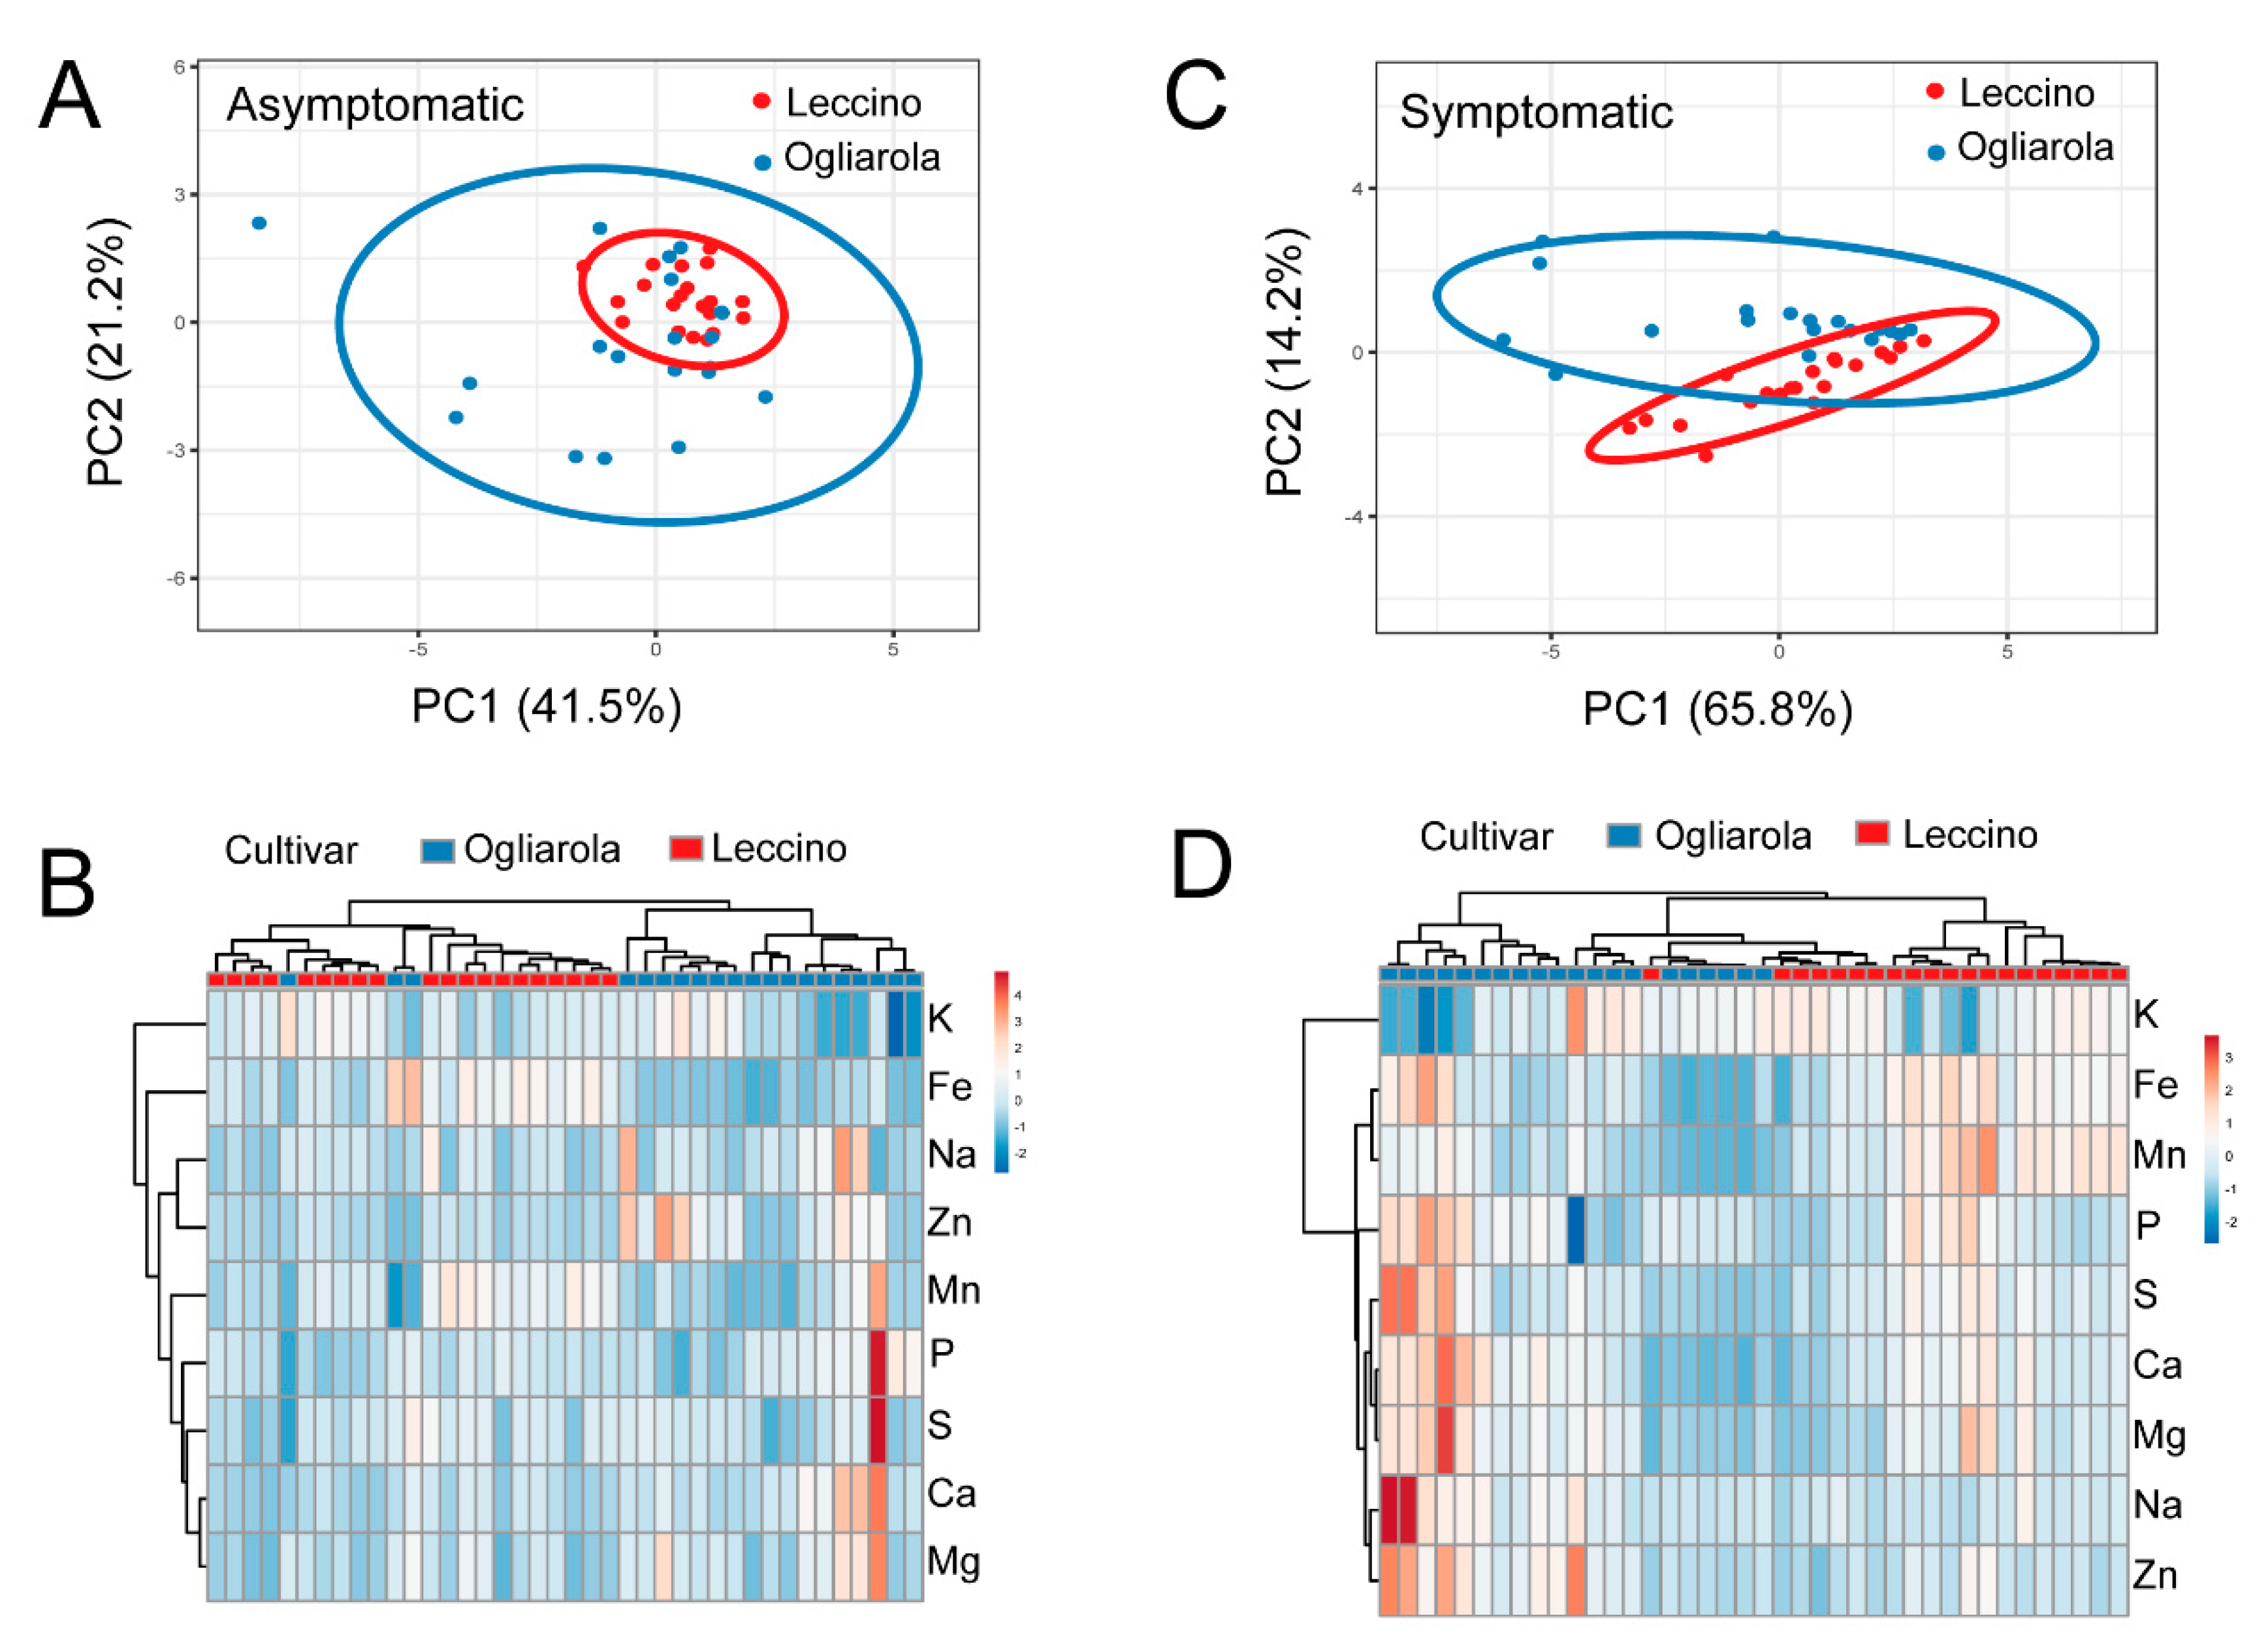
2. Results
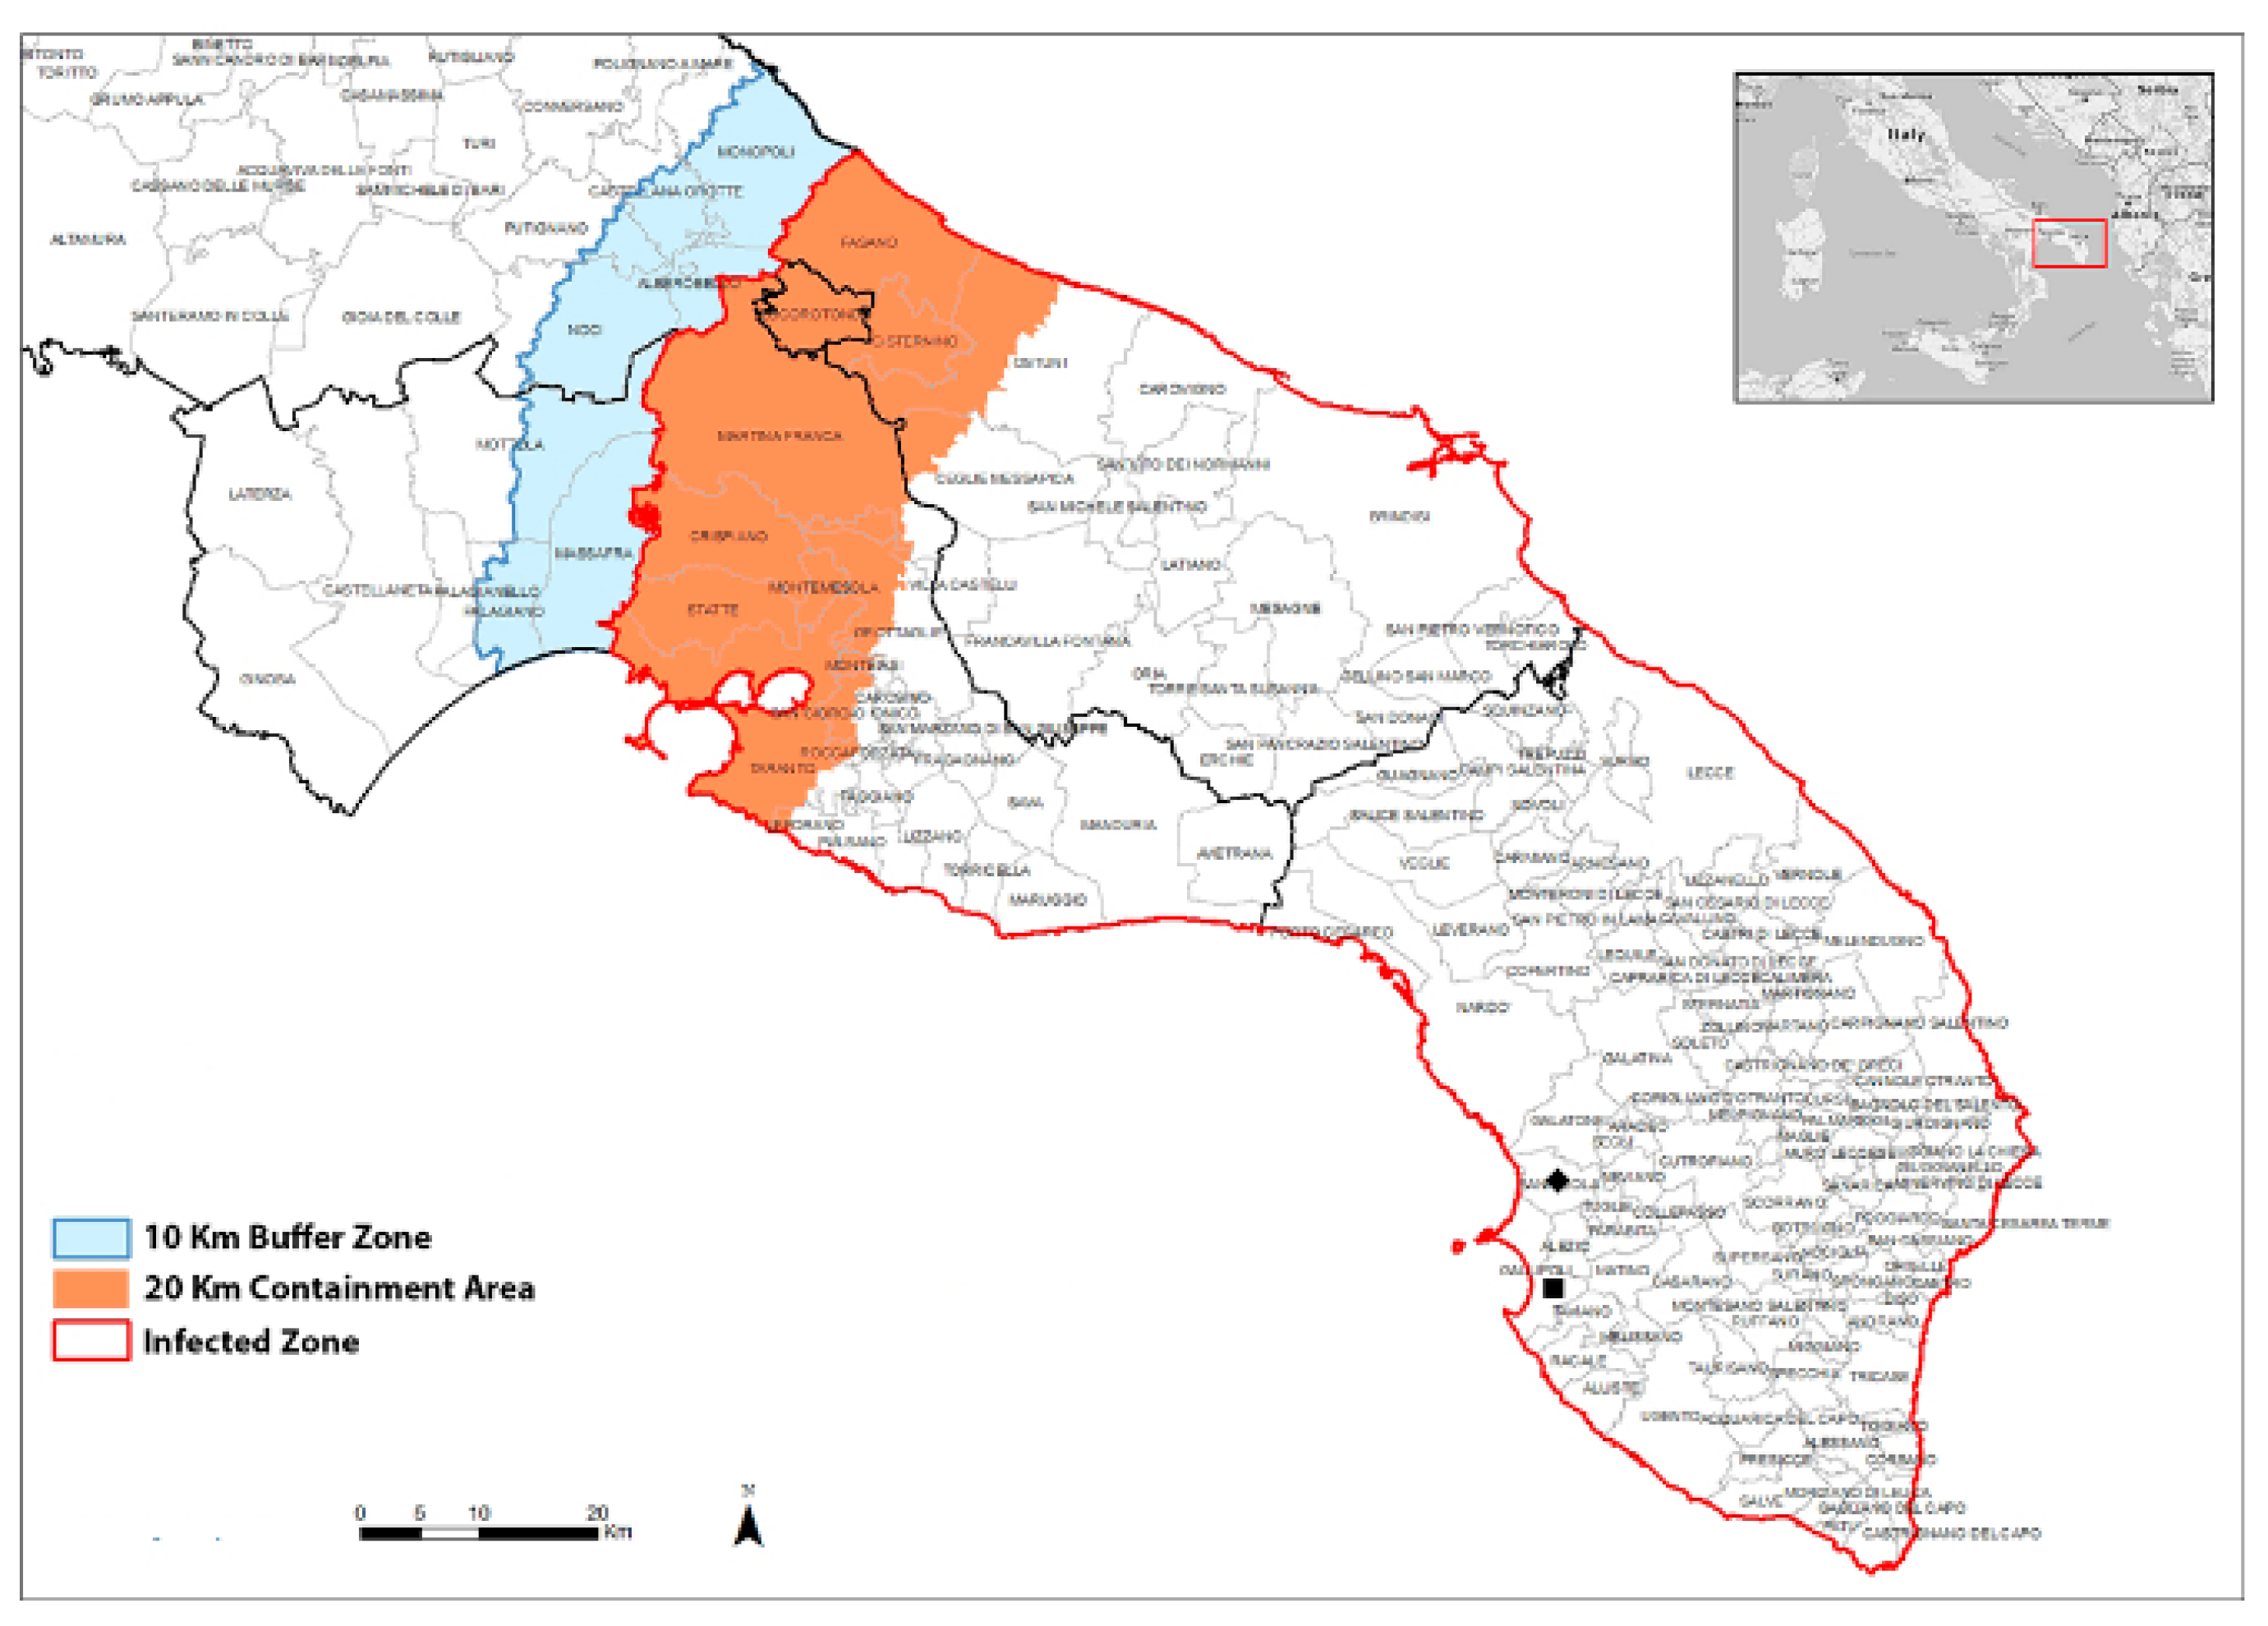
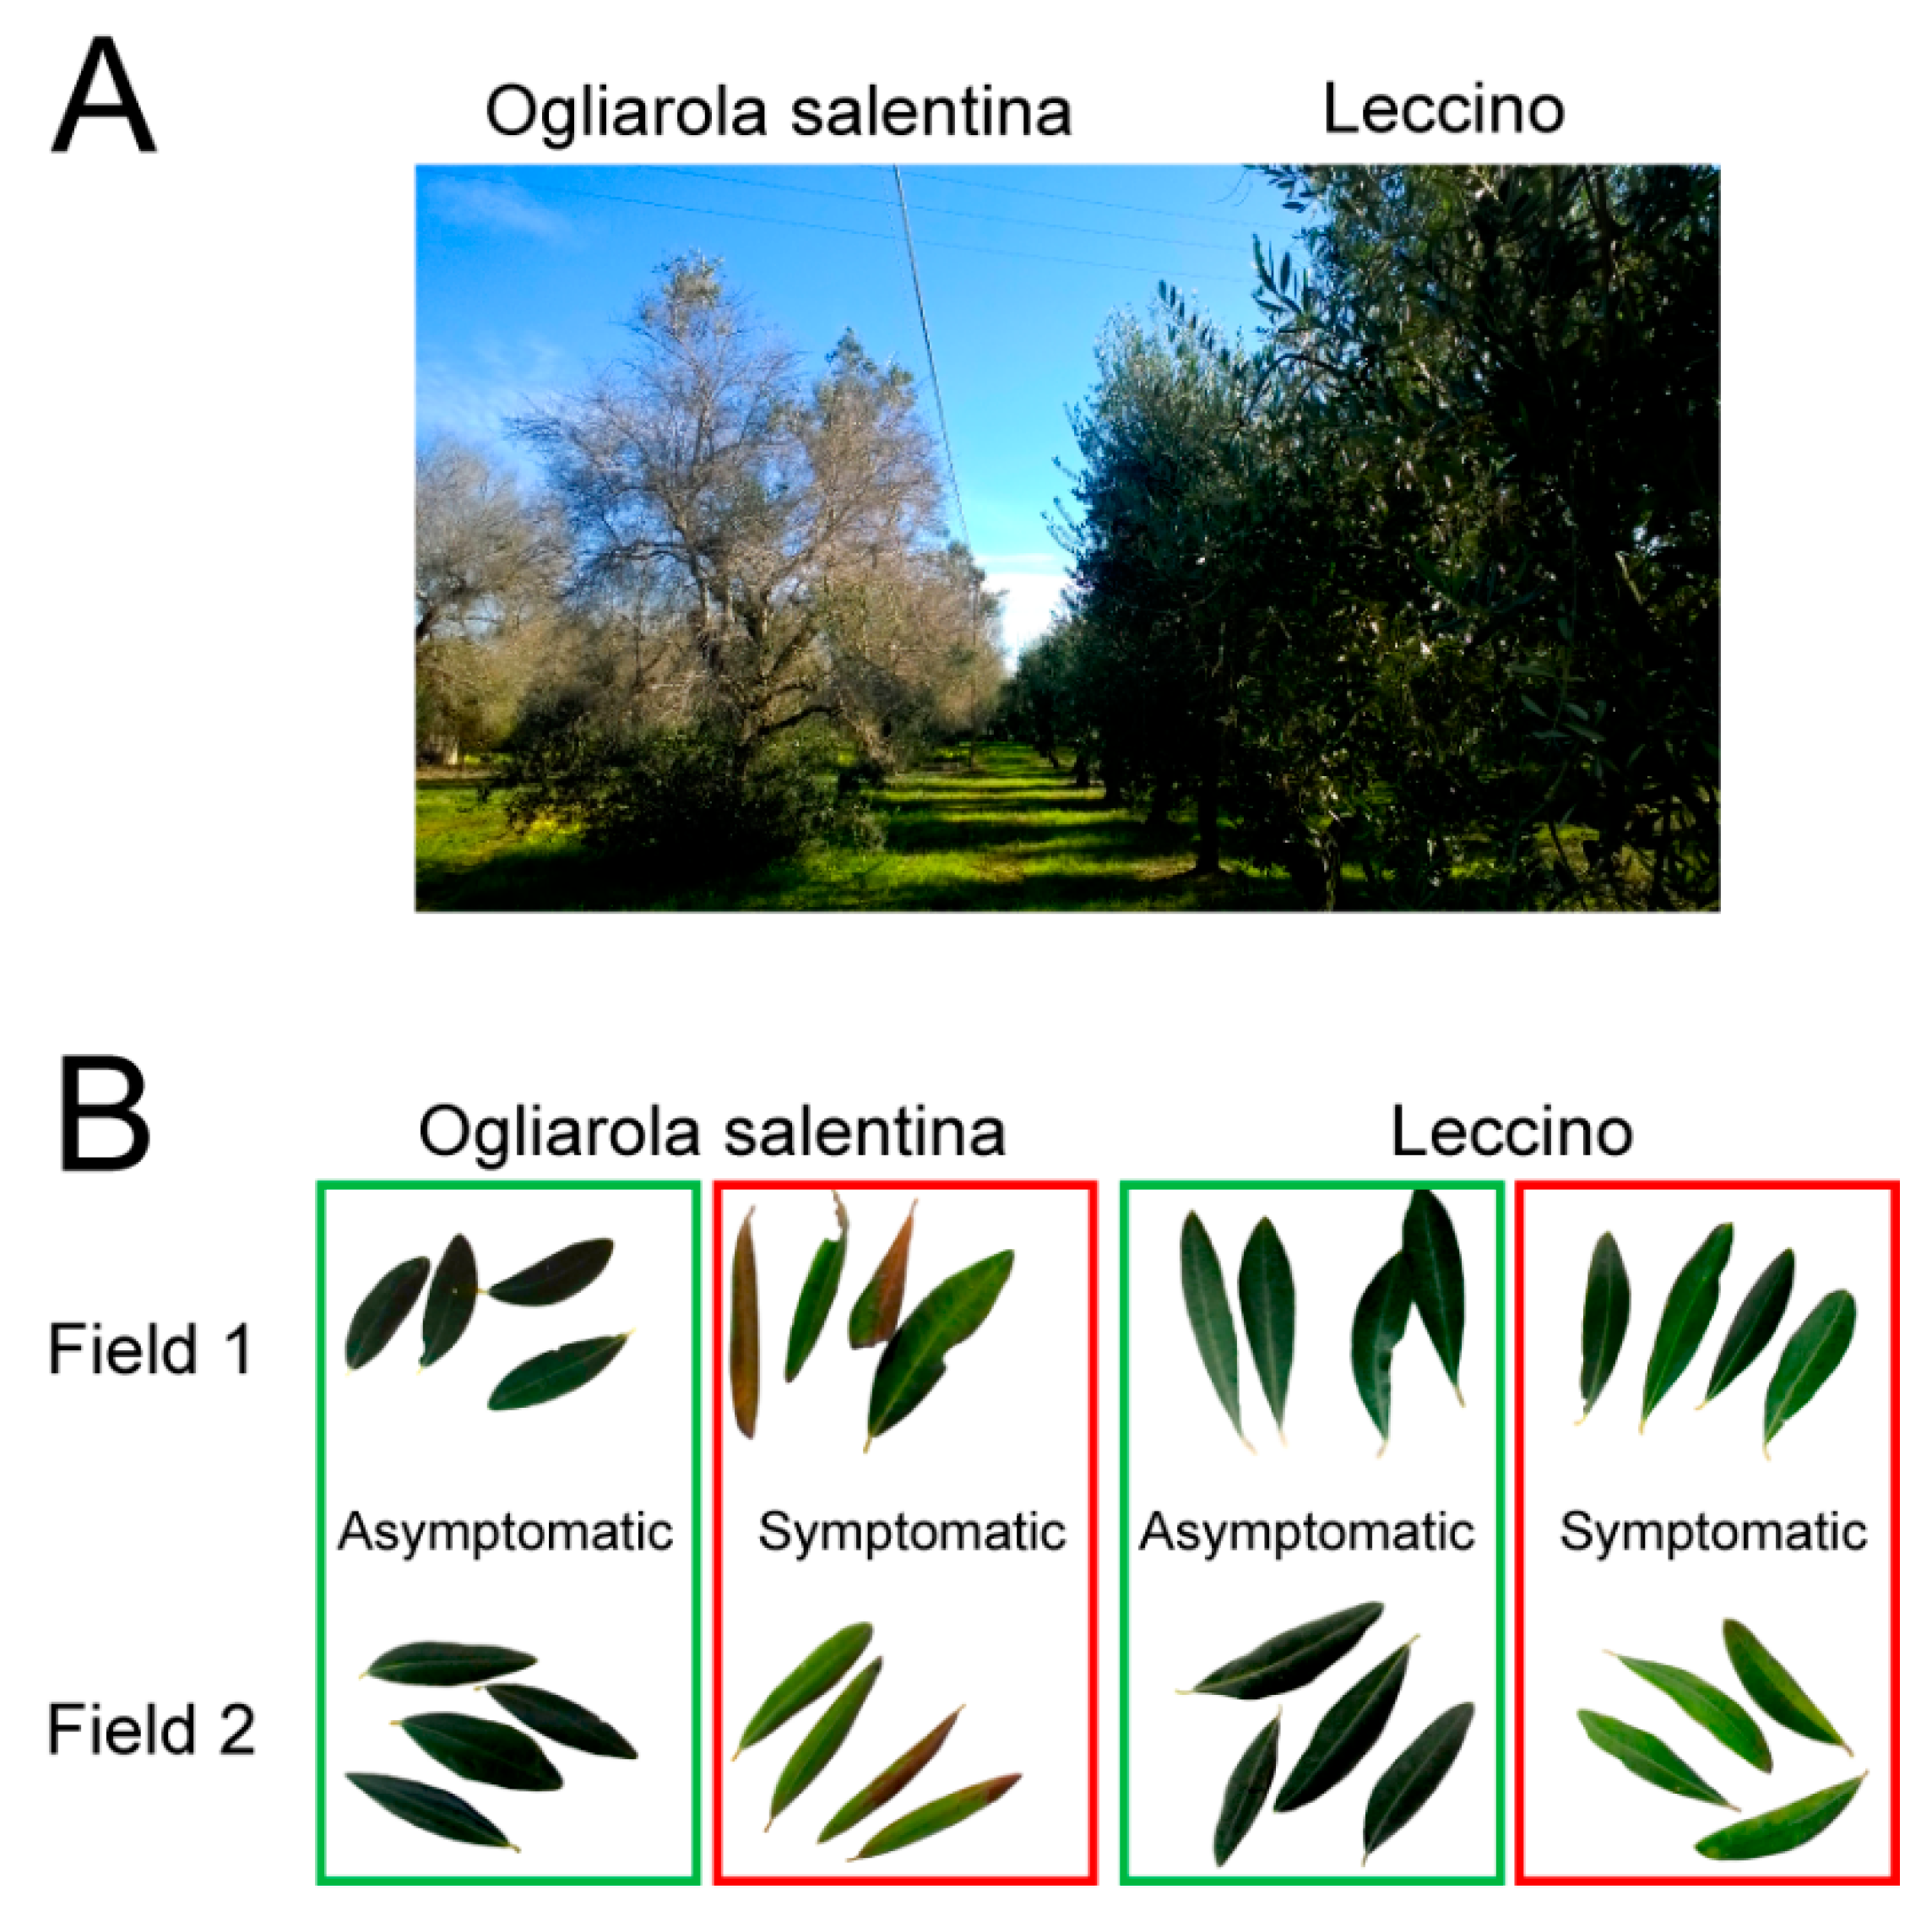
2.1. Field Survey
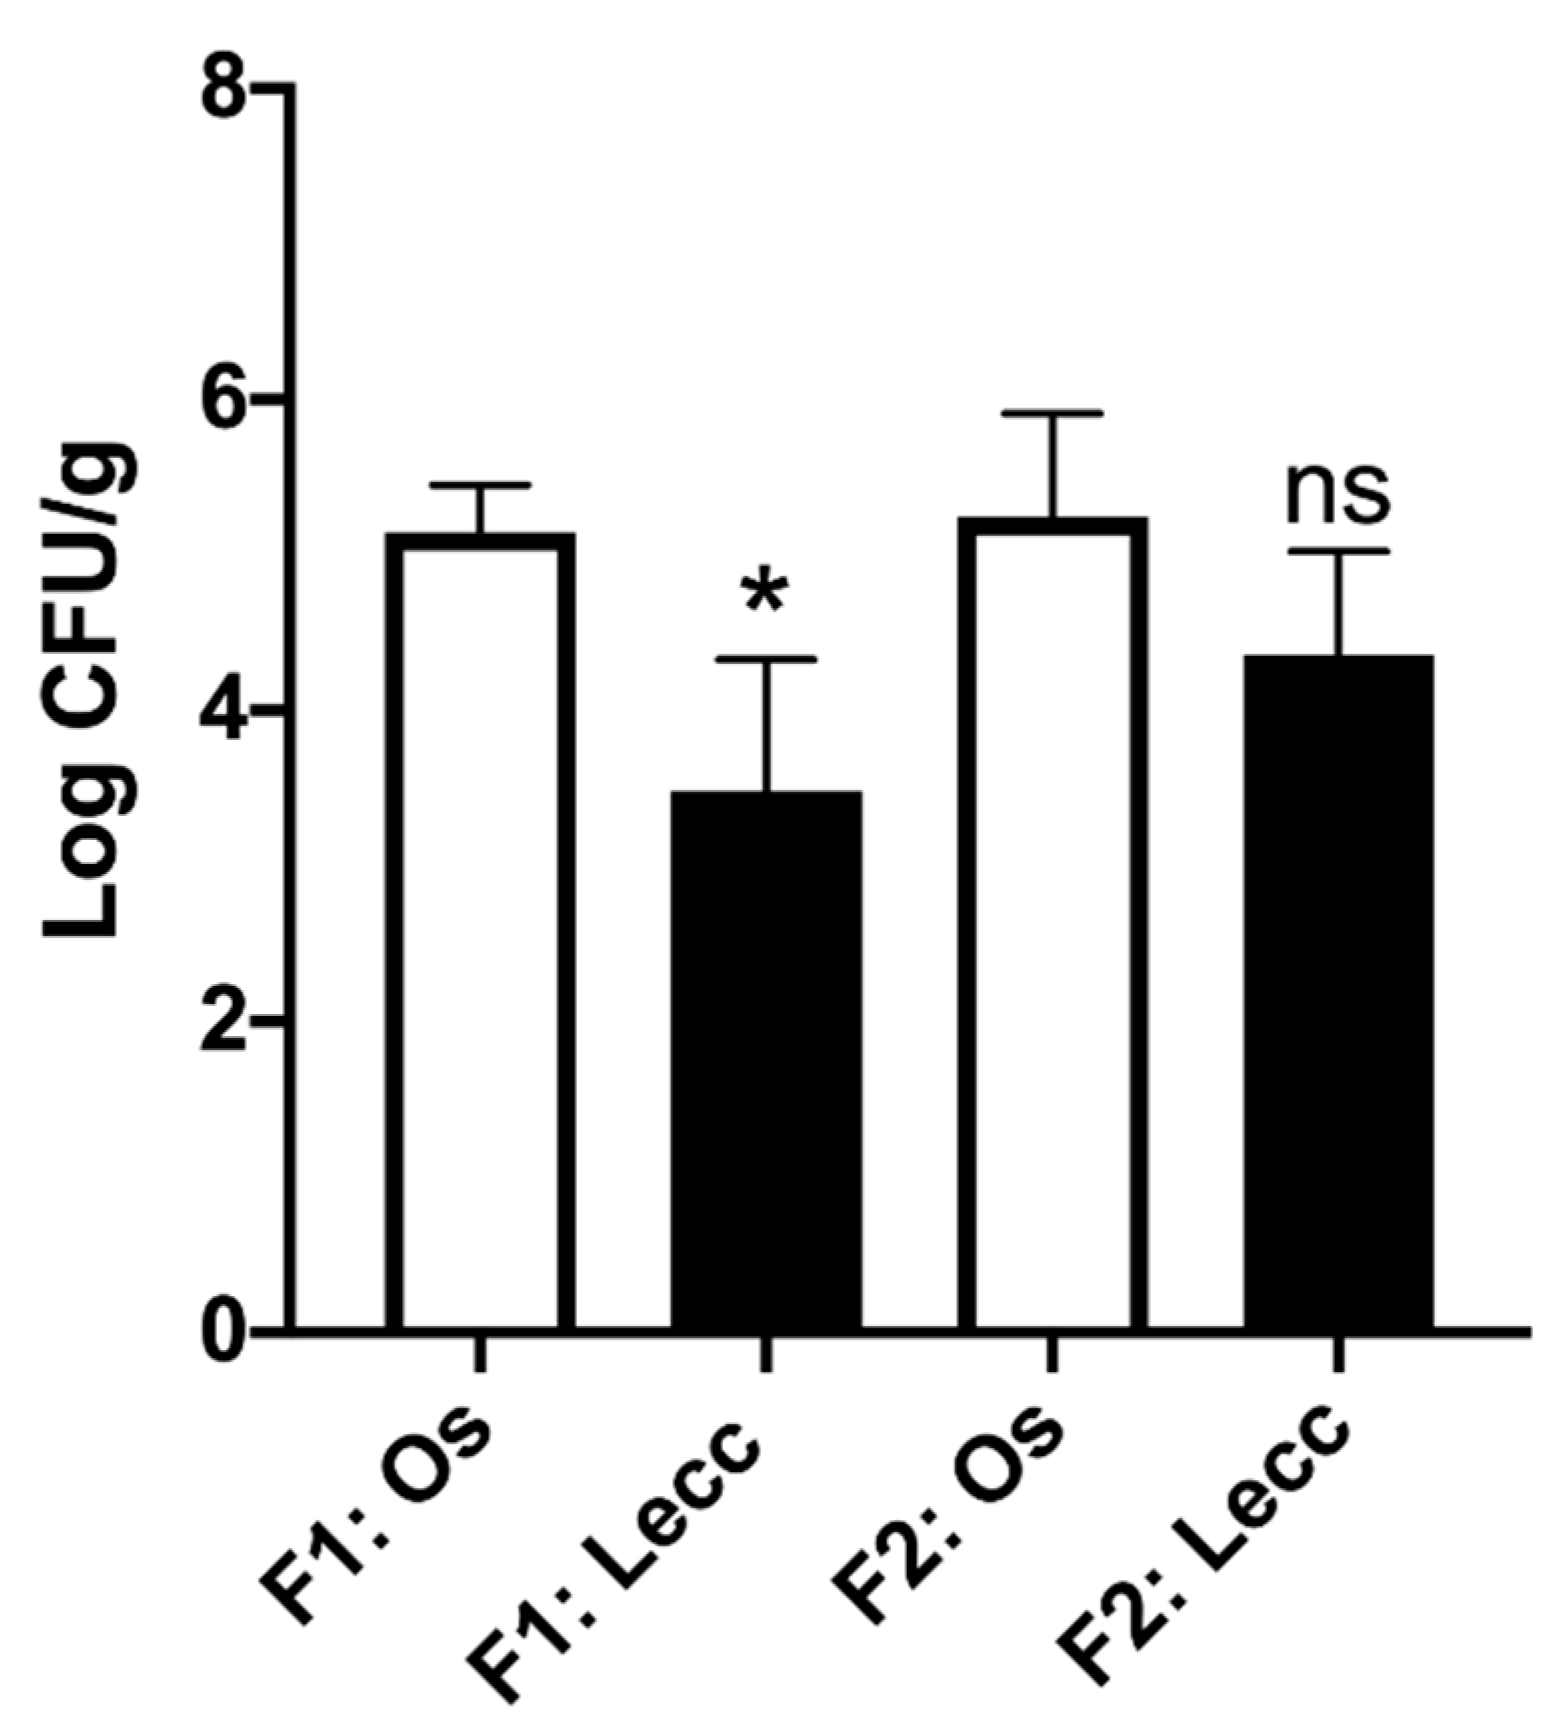
2.2. Population Size of Xylella fastidiosa within the Two Cultivars
2.3. Determination of Leaf Ionome and Soil Parameters
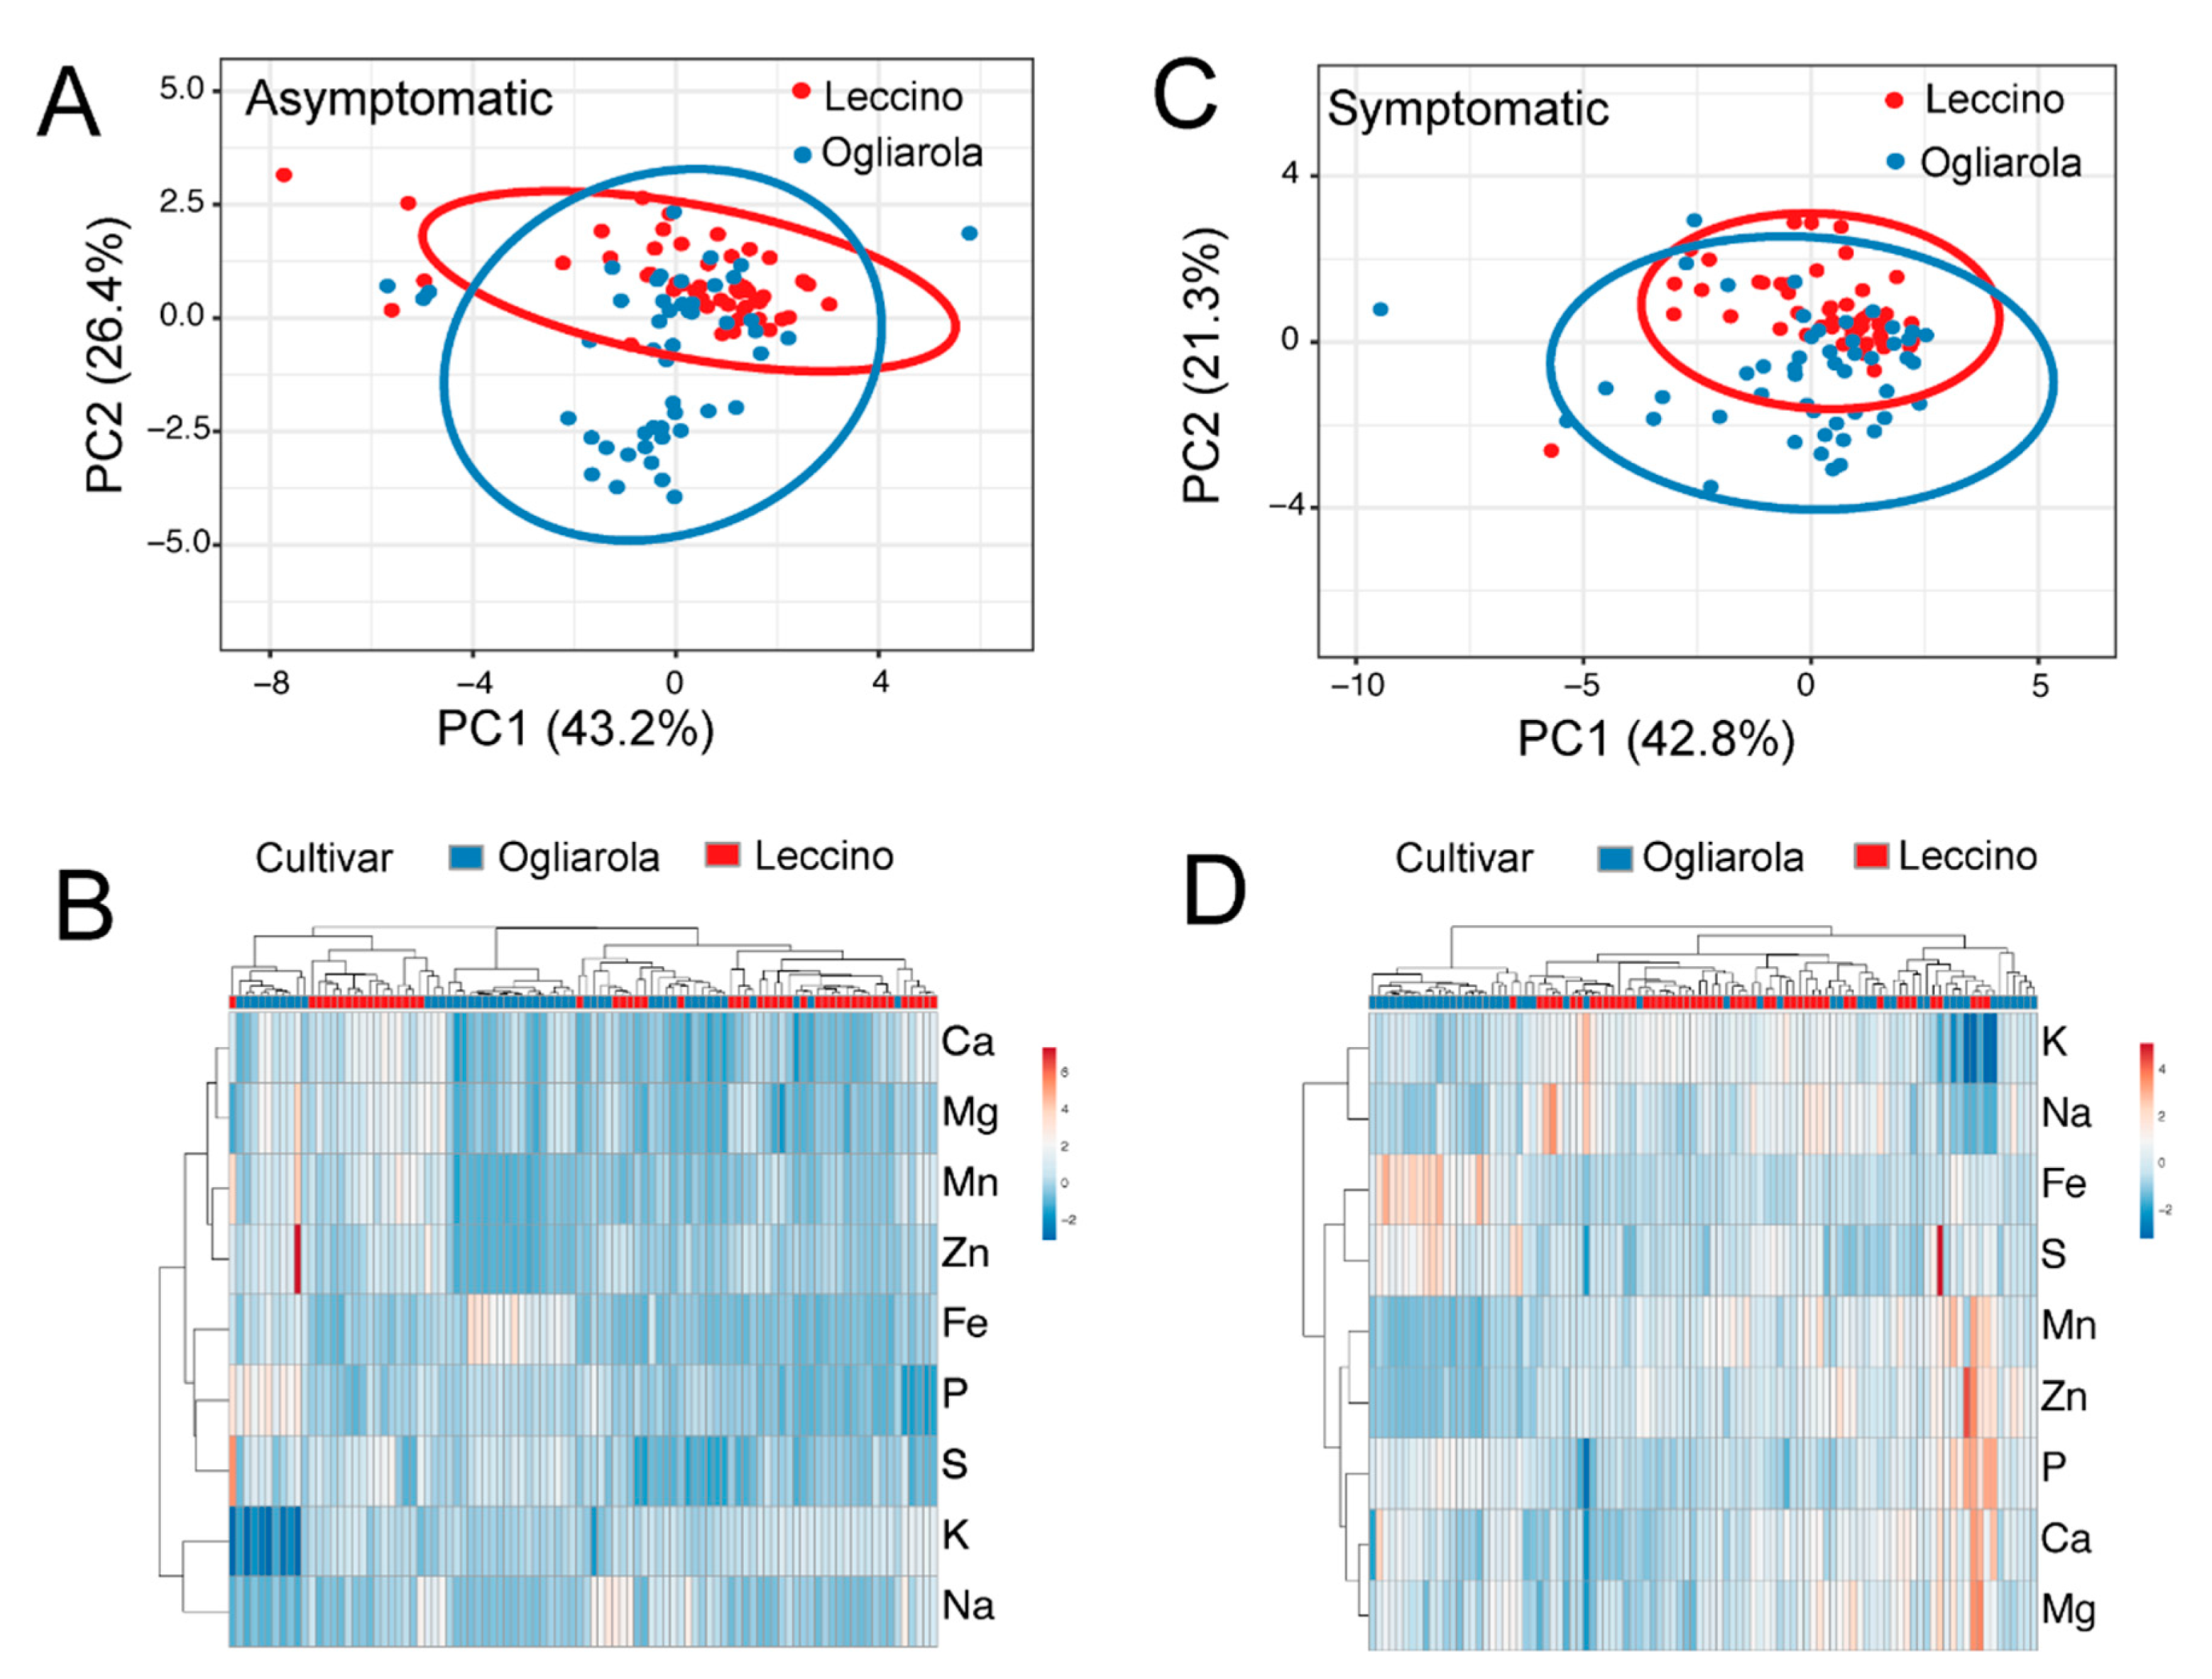
2.4. Ionome of Leccino and Ogliarola Salentina
2.5. Ionome According to Symptomatology
3. Discussion
4. Materials and Methods
4.1. Field Survey Samples Collection
4.2. DNA Extraction and Bacterial Quantification
4.3. Ionome Characterization
4.4. Soil Sampling and Physicochemical Analysis
4.5. Statistical Analysis
Author Contributions
Funding
Acknowledgments
Conflicts of Interest
References
- Saponari, M.; Boscia, D.; Nigro, F.; Martelli, G.P. Identification of DNA Sequences Related to Xylella fastidiosa in Oleander, Almond and Olive Trees Exhibiting Leaf Scorch Symptoms in Apulia (Southern Italy). J. Plant Pathol. 2013, 95, 668. [Google Scholar]
- Saponari, M.; Boscia, D.; Altamura, G.; Loconsole, G.; Zicca, S.; D’Attoma, G.; Morelli, M.; Palmisano, F.; Saponari, A.; Tavano, D.; et al. Isolation and pathogenicity of Xylella fastidiosa associated to the olive quick decline syndrome in southern Italy. Sci. Rep. 2017, 7, 17723. [Google Scholar] [CrossRef] [PubMed]
- Hopkins, D.L.; Purcell, A.H. Xylella fastidiosa: Cause of Pierce’s disease of grapevine and other emergent diseases. Plant Dis. 2002, 86, 1056–1066. [Google Scholar] [CrossRef] [PubMed]
- Baccari, C.; Lindow, S.E. Assessment of the Process of Movement of Xylella fastidiosa Within Susceptible and Resistant Grape Cultivars. Phytopathology 2011, 101, 77–84. [Google Scholar] [CrossRef] [PubMed]
- Chatterjee, S.; Almeida, R.P.P.; Lindow, S. Living in two worlds: The plant and insect lifestyles of Xylella fastidiosa. Annu. Rev. Phytopathol. 2008, 46, 243–271. [Google Scholar] [CrossRef]
- Sun, Q.; Sun, Y.L.; Walker, M.A.; Labavitch, J.M. Vascular Occlusions in Grapevines with Pierce’s Disease Make Disease Symptom Development Worse. Plant Physiol. 2013, 161, 1529–1541. [Google Scholar] [CrossRef] [PubMed]
- Choi, H.K.; Iandolino, A.; da Silva, F.G.; Cook, D.R. Water Deficit Modulates the Response of Vitis vinifera to the Pierce’s Disease Pathogen Xylella fastidiosa. Mol. Plant Microbe. Interact. 2013, 26, 643–657. [Google Scholar] [CrossRef]
- Rapicavoli, J.N.; Blanco-Ulate, B.; Muszynski, A.; Figueroa-Balderas, R.; Morales-Cruz, A.; Azadi, P.; Dobruchowska, J.M.; Castro, C.; Cantu, D.; Roper, M.C. Lipopolysaccharide O-antigen delays plant innate immune recognition of Xylella fastidiosa. Nat. Commun. 2018, 9, 390. [Google Scholar] [CrossRef]
- Rodrigues, C.M.; De Souza, A.A.; Takita, M.A.; Kishi, L.T.; Machado, M.A. RNA-Seq analysis of Citrus reticulata in the early stages of Xylella fastidiosa infection reveals auxin-related genes as a defense response. BMC Genomics 2013, 14, 676. [Google Scholar] [CrossRef]
- Bhattacharyya, A.; Stilwagen, S.; Reznik, G.; Feil, H.; Feil, W.S.; Anderson, I.; Bernal, A.; D’Souza, M.; Ivanova, N.; Kapatral, V.; et al. Draft sequencing and comparative genomics of Xylella fastidiosa strains reveal novel biological insights. Genome Res. 2002, 12, 1556–1563. [Google Scholar] [CrossRef]
- Hopkins, D.L. Xylella-Fastidiosa—Xylem-Limited Bacterial Pathogen of Plants. Annu. Rev. Phytopathol. 1989, 27, 271–290. [Google Scholar] [CrossRef]
- Agrios, G.N. Plant Pathology, 5th ed.; Elsevier Academic Press Cambridge: Cambridge, MA, USA, 2005. [Google Scholar]
- Ruel, J.J.; Walker, M.A. Resistance to Pierce’s disease in Muscadinia rotundifolia and other native grape species. Am. J. Enol. Viticult. 2006, 57, 158–165. [Google Scholar]
- Martelli, G.P. The current status of the quick decline syndrome of olive in southern Italy. Phytoparasitica 2016, 44, 1–10. [Google Scholar] [CrossRef]
- Boscia, D.; Saponari, M.; Palmisano, F.; Loconsole, G.; Martelli, G.P.; Savino, V.N. Field observations on the behaviour of different olive cultivars in response to Xylella fastidiosa infections. J. Plant Pathol. 2014, 96, 107. [Google Scholar]
- Giampetruzzi, A.; Morelli, M.; Saponari, M.; Loconsole, G.; Chiumenti, M.; Boscia, D.; Savino, V.N.; Martelli, G.P.; Saldarelli, P. Transcriptome profiling of two olive cultivars in response to infection by the CoDiRO strain of Xylella fastidiosa subsp pauca. BMC Genomics 2016, 17, 475. [Google Scholar] [CrossRef]
- Coletta, H.D.; Pereira, E.O.; Souza, A.A.; Takita, M.A.; Cristofani-Yale, M.; Machado, M.A. Analysis of resistance to Xylella fastidiosa within a hybrid population of Pera sweet orange x Murcott tangor. Plant Pathol. 2007, 56, 661–668. [Google Scholar] [CrossRef]
- Fry, S.M.; Milholland, R.D. Multiplication and Translocation of Xylella fastidiosa in Petioles and Stems of Grapevine Resistant, Tolerant, and Susceptible to Pierces Disease. Phytopathology 1990, 80, 61–65. [Google Scholar] [CrossRef]
- Krivanek, A.F.; Walker, M.A. Vitis resistance to Pierce’s disease is characterized by differential Xylella fastidiosa populations in stems and leaves. Phytopathology 2005, 95, 44–52. [Google Scholar] [CrossRef]
- Waldron, K.J.; Rutherford, J.C.; Ford, D.; Robinson, N.J. Metalloproteins and metal sensing. Nature 2009, 460, 823–830. [Google Scholar] [CrossRef]
- Maathuis, F.J.M. Physiological functions of mineral macronutrients. Curr. Opin. Plant Biol. 2009, 12, 250–258. [Google Scholar] [CrossRef]
- Hansch, R.; Mendel, R.R. Physiological functions of mineral micronutrients (Cu, Zn, Mn, Fe, Ni, Mo, B, Cl). Curr. Opin. Plant Biol. 2009, 12, 259–266. [Google Scholar] [CrossRef] [PubMed]
- Hood, M.I.; Skaar, E.P. Nutritional immunity: Transition metals at the pathogen-host interface. Nat. Rev. Microbiol. 2012, 10, 525–537. [Google Scholar] [CrossRef] [PubMed]
- Lahner, B.; Gong, J.M.; Mahmoudian, M.; Smith, E.L.; Abid, K.B.; Rogers, E.E.; Guerinot, M.L.; Harper, J.F.; Ward, J.M.; McIntyre, L.; et al. Genomic scale profiling of nutrient and trace elements in Arabidopsis thaliana. Nat. Biotechnol. 2003, 21, 1215–1221. [Google Scholar] [CrossRef] [PubMed]
- Baxter, I.; Dilkes, B.P. Elemental Profiles Reflect Plant Adaptations to the Environment. Science 2012, 336, 1661–1663. [Google Scholar] [CrossRef]
- Baxter, I.R.; Vitek, O.; Lahner, B.; Muthukumar, B.; Borghi, M.; Morrissey, J.; Guerinot, M.L.; Salt, D.E. The leaf ionome as a multivariable system to detect a plant’s physiological status. Proc. Natl. Acad. Sci. USA 2008, 105, 12081–12086. [Google Scholar] [CrossRef]
- Andersen, P.C.; French, W.J. Biophysical Characteristics of Peach-Trees Infected with Phony Peach Disease. Physiol. Mol. Plant Pathol. 1987, 31, 25–40. [Google Scholar] [CrossRef]
- Goodwin, P.H.; Devay, J.E.; Meredith, C.P. Physiological-Responses of Vitis-Vinifera Cv—Chardonnay to Infection by the Pierces Disease Bacterium. Physiol. Mol. Plant Pathol. 1988, 32, 17–32. [Google Scholar] [CrossRef]
- Silva-Stenico, M.E.; Pacheco, F.T.H.; Pereira, E.R.; Rodrigues, J.L.M.; Souza, A.N.; Etchegaray, A.; Gomes, J.E.; Tsai, S.M. Nutritional deficiency in citrus with symptoms of citrus variegated chlorosis disease. Braz. J. Biol. 2009, 69, 859–864. [Google Scholar] [CrossRef]
- Leite, B.; Ishida, M.L.; Alves, E.; Carrer, H.; Pascholati, S.F.; Kitajima, E.W. Genomics and X-ray microanalysis indicate that Ca2+ and thiols mediate the aggregation and adhesion of Xylella fastidiosa. Braz. J. Med. Biol. Res. 2002, 35, 645–650. [Google Scholar] [CrossRef]
- Cruz, L.F.; Cobine, P.A.; De La Fuente, L. Calcium Increases Xylella fastidiosa Surface Attachment, Biofilm Formation, and Twitching Motility. Appl. Environ. Microb. 2012, 78, 1321–1331. [Google Scholar] [CrossRef]
- Cruz, L.F.; Parker, J.K.; Cobine, P.A.; De La Fuente, L. Calcium-Enhanced Twitching Motility in Xylella fastidiosa Is Linked to a Single PilY1 Homolog. Appl. Environ. Microbiol. 2014, 80, 7176–7185. [Google Scholar] [CrossRef] [PubMed]
- Cobine, P.A.; Cruz, L.F.; Navarrete, F.; Duncan, D.; Tygart, M.; De La Fuente, L. Xylella fastidiosa Differentially Accumulates Mineral Elements in Biofilm and Planktonic Cells. PLoS ONE 2013, 8, e5493610. [Google Scholar] [CrossRef] [PubMed]
- Kailis, S.; Harris, D. Fertiliser Requirements and Monitoring Nutritional Status; Landlinks Press: Collingwood, Australia, 2007. [Google Scholar]
- Pagan, I.; Garcia-Arenal, F. Tolerance to Plant Pathogens: Theory and Experimental Evidence. Int. J. Mol. Sci. 2018, 19, 810. [Google Scholar] [CrossRef] [PubMed]
- Saponari, M.; Giampetruzzi, A.; Loconsole, G.; Boscia, D.; Saldarelli, P. Xylella fastidiosa in Olive in Apulia: Where We Stand. Phytopathology 2019, 109, 175–186. [Google Scholar] [CrossRef] [Green Version]
- Luvisi, A.; Aprile, A.; Sabella, E.; Vergine, M.; Nicoli, F.; Nutricati, E.; Miceli, A.; Negro, C.; De Bellis, L. Xylella fastidiosa subsp pauca (CoDiRO strain) infection in four olive (Olea europaea L.) cultivars: Profile of phenolic compounds in leaves and progression of leaf scorch symptoms. Phytopathol. Mediterr. 2017, 56, 259–273. [Google Scholar] [CrossRef]
- Nicoli, F.; Negro, C.; Nutricati, E.; Vergine, M.; Aprile, A.; Sabella, E.; Damiano, G.; De Bellis, L.; Luvisi, A. Accumulation of Azelaic Acid in Xylella fastidiosa-Infected Olive Trees: A Mobile Metabolite for Health Screening. Phytopathology 2019, 109, 318–325. [Google Scholar] [CrossRef] [PubMed] [Green Version]
- Novelli, S.; Gismondi, A.; Di Marco, G.; Canuti, L.; Nanni, V.; Canini, A. Plant defense factors involved in Olea europaea resistance against Xylella fastidiosa infection. J. Plant Res. 2019, 132, 439–455. [Google Scholar] [CrossRef]
- Sabella, E.; Aprile, A.; Genga, A.; Siciliano, T.; Nutricati, E.; Nicoli, F.; Vergine, M.; Negro, C.; De Bellis, L.; Luvisi, A. Xylem cavitation susceptibility and refilling mechanisms in olive trees infected by Xylella fastidiosa. Sci. Rep. 2019, 9, 1–11. [Google Scholar] [CrossRef] [Green Version]
- Sabella, E.; Luvisi, A.; Aprile, A.; Negro, C.; Vergine, M.; Nicoli, F.; Miceli, A.; De Bellis, L. Xylella fastidiosa induces differential expression of lignification related-genes and lignin accumulation in tolerant olive trees cv. Leccino. J. Plant Physiol. 2018, 220, 60–68. [Google Scholar] [CrossRef]
- Scortichini, M.; Migoni, D.; Angile, F.; Del Coco, L.; Girelli, C.R.; Zampella, L.; Mastrobuoni, F.; Fanizzi, F.P. Xylella fastidiosa subsp. pauca on olive in Salento (Southern Italy): Infected trees have low in planta micronutrient content. Phytopathol. Mediterr. 2019, 58, 39–48. [Google Scholar] [CrossRef]
- Burnell, J.N. The Biochemistry of Manganese in Plants; Springer: Dordrecht, The Netherlands, 1988. [Google Scholar]
- Simpson, A.J.G.; Reinach, F.C.; Arruda, P.; Abreu, F.A.; Acencio, M.; Alvarenga, R.; Alves, L.M.C.; Araya, J.E.; Baia, G.S.; Baptista, C.S.; et al. The genome sequence of the plant pathogen Xylella fastidiosa. Nature 2000, 406, 151–157. [Google Scholar] [CrossRef] [PubMed] [Green Version]
- Bowler, C.; Slooten, L.; Vandenbranden, S.; Derycke, R.; Botterman, J.; Sybesma, C.; Vanmontagu, M.; Inze, D. Manganese Superoxide-Dismutase Can Reduce Cellular-Damage Mediated by Oxygen Radicals in Transgenic Plants. Embo J. 1991, 10, 1723–1732. [Google Scholar] [CrossRef] [PubMed]
- Requena, L.; Bornemann, S. Barley (Hordeum vulgare) oxalate oxidase is a manganese-containing enzyme. Biochem. J. 1999, 343, 185–190. [Google Scholar] [CrossRef] [PubMed]
- Ducic, T.; Polle, A. Transport and detoxification of manganese and copper in plants. Braz. J. Plant Physiol. 2005, 17, 103–112. [Google Scholar] [CrossRef] [Green Version]
- Hakala, M.; Rantamaki, S.; Puputti, E.M.; Tyystjarvi, T.; Tyystjarvi, E. Photoinhibition of manganese enzymes: Insights into the mechanism of photosystem II photoinhibition. J. Exp. Bot. 2006, 57, 1809–1816. [Google Scholar] [CrossRef] [Green Version]
- Hakala, M.; Tuominen, I.; Keranen, M.; Tyystjarvi, T.; Tyystjarvi, E. Evidence for the role of the oxygen-evolving manganese complex in photoinhibition of Photosystem II. Bba-Bioenergetics 2005, 1706, 68–80. [Google Scholar] [CrossRef] [Green Version]
- Torres, M.A.; Jones, J.D.G.; Dangl, J.L. Reactive oxygen species signaling in response to pathogens. Plant Physiol. 2006, 141, 373–378. [Google Scholar] [CrossRef] [Green Version]
- Apostol, I.; Heinstein, P.F.; Low, P.S. Rapid Stimulation of an Oxidative Burst during Elicitation of Cultured Plant-Cells—Role in Defense and Signal Transduction. Plant Physiol. 1989, 90, 109–116. [Google Scholar] [CrossRef] [Green Version]
- De La Fuente, L.; Parker, J.K.; Oliver, J.E.; Granger, S.; Brannen, P.M.; van Santen, E.; Cobine, P.A. The bacterial pathogen Xylella fastidiosa affects the leaf ionome of plant hosts during infection. PLoS ONE 2013, 8, e62945. [Google Scholar] [CrossRef] [Green Version]
- McElrone, A.J.; Sherald, J.L.; Forseth, I.N. Interactive effects of water stress and xylem-limited bacterial infection on the water relations of a host vine. J. Exp. Bot 2003, 54, 419–430. [Google Scholar] [CrossRef]
- Blum, A.; Munns, R.; Passioura, J.B.; Turner, N.C. Genetically engineered plants resistant to soil drying and salt stress: How to interpret osmotic relations? Plant Physiol. 1996, 110, 1051. [Google Scholar] [CrossRef] [PubMed] [Green Version]
- Martinez, J.P.; Ledent, J.F.; Bajji, M.; Kinet, J.M.; Lutts, S. Effect of water stress on growth, Na+ and K+ accumulation and water use efficiency in relation to osmotic adjustment in two populations of Atriplex halimus L. Plant Growth Regul. 2003, 41, 63–73. [Google Scholar] [CrossRef]
- Blumenthal-Goldschmidt, S.; Poljakoff-Mayber, A. Effect of substrate salinity on grwith and on submicroscopic structure of leaf cells of Atriplex halimus L. Aust. J. Bot. 1968, 16, 469–478. [Google Scholar]
- Brownell, P.F.; Bielig, L.M. The role of sodium in the conversion of pyruvate to phosphoenolpyruvate in mesophyll chloroplasts of C-4 plants. Aust. J. Plant Physiol. 1996, 23, 171–177. [Google Scholar] [CrossRef]
- Grof, C.P.L.; Johnston, M.; Brownell, P.F. Effect of Sodium Nutrition on the Ultrastructure of Chloroplasts of C-4 Plants. Plant Physiol. 1989, 89, 539–543. [Google Scholar] [CrossRef] [Green Version]
- Murata, S.; Kobayashi, M.; Matoh, T.; Sekiya, J. Sodium Stimulates Regeneration of Phosphoenolpyruvate in Mesophyll Chloroplasts of Amaranthus-Tricolor. Plant Cell Physiol. 1992, 33, 1247–1250. [Google Scholar]
- Ohnishi, J.; Flugge, U.I.; Heldt, H.W.; Kanai, R. Involvement of Na+ in Active Uptake of Pyruvate in Mesophyll Chloroplasts of Some C4 Plants—Na+/Pyruvate Cotransport. Plant Physiol. 1990, 94, 950–959. [Google Scholar] [CrossRef] [Green Version]
- Fritschi, F.B.; Lin, H.; Walker, M.A. Scanning electron Microscopy reveals different response pattern of four Vitis genotypes to Xylella fastidiosa infection. Plant Dis. 2008, 92, 276–286. [Google Scholar] [CrossRef]
- Clarkson, D.T. Calcium-Transport between Tissues and Its Distribution in the Plant. Plant Cell Environ. 1984, 7, 449–456. [Google Scholar] [CrossRef]
- Barker, A.; Pilbeam, D.J. Handbook of Plant Nutrition; CRC Press: Boca Raton, FL, USA, 2015. [Google Scholar]
- Bengtsson, B. Uptake and Translocation of Calcium in Cucumber. Physiol. Plant. 1982, 54, 107–111. [Google Scholar] [CrossRef]
- Marschner, H. Mineral Nutrition of Higher Plants; Academic Press: London, UK, 1995. [Google Scholar]
- Lecourieux, D.; Ranjeva, R.; Pugin, A. Calcium in plant defence-signalling pathways. New Phytol. 2006, 171, 249–269. [Google Scholar] [CrossRef] [PubMed]
- Sanchez-Rodriguez, E.; Rubio-Wilhelmi, M.D.; Cervilla, L.M.; Blasco, B.; Rios, J.J.; Leyva, R.; Romero, L.; Ruiz, J.M. Study of the ionome and uptake fluxes in cherry tomato plants under moderate water stress conditions. Plant Soil 2010, 335, 339–347. [Google Scholar] [CrossRef]
- Peuke, A.D.; Rennenberg, H. Impacts of drought on mineral macro- and microelements in provenances of beech (Fagus sylvatica L.) seedlings. Tree Physiol. 2011, 31, 196–207. [Google Scholar] [CrossRef] [PubMed]
- Harper, S.J.; Ward, L.I.; Clover, G.R.G. Development of LAMP and Real-Time PCR Methods for the Rapid Detection of Xylella fastidiosa for Quarantine and Field Applications. Phytopathology 2010, 100, 1282–1288. [Google Scholar] [CrossRef] [PubMed]
- McKenzie, H.A. The kjeldahl determination of nitrogen: Retrospect and prospect. TrAC Trends Anal. Chem. 1994, 13, 138–144. [Google Scholar] [CrossRef]
- Lindsey, W.L.; Norwell, M.A. A new DPTA-TEA soil test for zinc and iron. Agron. Abstr. 1969, 61, 84. [Google Scholar]
- Metsalu, T.; Vilo, J. ClustVis: A web tool for visualizing clustering of multivariate data using Principal Component Analysis and heatmap. Nucleic Acids Res. 2015, 43, W566–W570. [Google Scholar] [CrossRef]


| Ca | K | Mg | S | P | Fe | Mn | Na | Zn | ||
|---|---|---|---|---|---|---|---|---|---|---|
| Reference * | g/kg or mg/kg | 10–14 | 8–10 | 1–1.6 | 0.8–1.6 | 1–1.3 | 90–124 | 20–36 | <200 | 4–9 |
| Field 1 | ||||||||||
| Leccino | Asymp | 13.7 | 3.9 | 1.8 | 1.6 | 1.3 | 41.5 | 43.4 | 33.0 | 9.3 |
| Symp | 16.2 | 4.2 | 1.6 | 1.5 | 1.4 | 45.6 | 44.3 | 59.1 | 9.5 | |
| Ogliarola salentina | Asymp | 13.3 | 3.1 | 1.6 | 1.9 | 1.5 | 96.6 | 30.4 | 25.5 | 6.7 |
| Symp | 12.9 | 3.1 | 1.6 | 1.9 | 1.3 | 95.3 | 31.5 | 61.0 | 8.8 | |
| Field 2 | ||||||||||
| Leccino | Asymp | 6.4 | 4.2 | 1.0 | 1.5 | 1.2 | 63.4 | 44.4 | 15.3 | 7.1 |
| Symp | 11.3 | 3.8 | 1.5 | 1.6 | 1.6 | 87.6 | 80.5 | 48.9 | 10.2 | |
| Ogliarola salentina | Asymp | 10.6 | 3.8 | 1.5 | 1.7 | 1.2 | 42.1 | 29.6 | 23.1 | 10.7 |
| Symp | 14.6 | 3.4 | 2.0 | 1.8 | 1.7 | 60.6 | 40.3 | 126.8 | 18.4 | |
| Field 1 | Field 2 | ||||
|---|---|---|---|---|---|
| Reference Range | Ogliarola Mean ± St. Dev | Leccino Mean ± St. Dev | Ogliarola Mean ± St. Dev | Leccino Mean ± St. Dev | |
| Texture | |||||
| Skeleton (>2 mm) % | 0–10 | 0 | 0 | 1 ± 1.4 | 0 ± 0.00 |
| Sand (2–0.05 mm) % Fine Fraction | - | 51 ± 3 | 51 ± 3 | 47 ± 6 | 37 ± 3 |
| Silt (0.05–0.002 mm) % Fine Fraction | - | 25 ± 1 | 24 ± 4 | 32 ± 6 | 34 ± 0 |
| Clay (<0.002 mm) % Fine Fraction | - | 24 ± 4 | 25 ± 1 | 21 ± 0.7 | 29 ± 3 |
| Chemical and Physical Parameters | |||||
| pH in H2O (1:2.5) mS∙cm2 | 6.7–7.3 | 7.05 ± 0.49 | 8.05 ± 0.07 | 8.1 ± 0.14 | 7.3 ± 0.28 |
| Macro Elements | |||||
| Assimilable phosphorus (mg∙kg−1 Fine Fraction) | 27–32 | 70 ± 10 | 34 ± 3 | 7 ± 1 | 5 ± 0.9 |
| Exchangeable potassium (mg∙kg−1 Fine Fraction) | 200 | 310 ± 104 | 232 ± 52 | 355 ± 76 | 102 ± 8 |
| Exchangeable calcium (mg∙kg−1 Fine Fraction) | 3000 | 1601 ± 126 | 2231 ± 344 | 2610 ± 25 | 2130 ± 632 |
| Exchangeable sodium (mg∙kg−1 Fine Fraction) | 230 | 63 ± 27 | 96 ± 11 | 54 ± 1 | 37 ± 4 |
| Exchangeable magnesium (mg∙kg−1 Fine Fraction) | 200 | 211 ± 54 | 284 ± 104 | 322 ± 42 | 427 ± 88 |
| Micro Elements | |||||
| Assimilable iron (mg∙kg−1 Fine Fraction) | 5–40 | 16 ± 8 | 6 ± 0.3 | 4.4 ± 0.3 | 7.2 ± 1.3 |
| Assimilable manganese (mg∙kg−1 Fine Fraction) | 5–20 | 38 ± 7 | 27 ± 5 | 27 ± 3 | 57 ± 7.4 |
| Assimilable copper (mg∙kg−1 Fine Fraction) | 1–5 | 30 ± 2 | 22 ± 0.2 | 11.3 ± 1.7 | 8.6 ± 0.1 |
| Assimilable zinc (mg∙kg−1 Fine Fraction) | 0.5–2 | 1 ± 0.3 | 1.0 ± 0.01 | 1.5 ± 0.1 | 0.6 ± 0.04 |
| PC1 | PC2 | PC3 | PC4 | PC5 | PC6 | PC7 | PC8 | ||
|---|---|---|---|---|---|---|---|---|---|
| Field 1 | Asymp | 0.43 | 0.26 | 0.10 | 0.06 | 0.05 | 0.04 | 0.03 | 0.02 |
| Symp | 0.43 | 0.21 | 0.13 | 0.10 | 0.06 | 0.03 | 0.03 | 0.01 | |
| Field 2 | Asymp | 0.42 | 0.21 | 0.15 | 0.09 | 0.07 | 0.03 | 0.02 | 0.01 |
| Symp | 0.66 | 0.14 | 0.11 | 0.05 | 0.01 | 0.01 | 0.01 | 0.00 |
| CA | FE | K | MG | MN | NA | P | S | ZN | |||
| Field 1 | Asymp | PC1 | 0.40 | 0.17 | −0.46 | 0.38 | 0.22 | −0.27 | 0.46 | 0.27 | 0.22 |
| PC2 | 0.16 | −0.52 | 0.12 | 0.24 | 0.47 | 0.29 | −0.12 | −0.31 | 0.47 | ||
| Symp | PC1 | −0.37 | −0.14 | 0.37 | −0.41 | −0.39 | 0.04 | −0.37 | −0.32 | −0.38 | |
| PC2 | 0.33 | −0.45 | 0.39 | 0.23 | 0.31 | 0.37 | −0.40 | −0.18 | 0.23 | ||
| Field 2 | Asymp | PC1 | 0.49 | 0.07 | −0.16 | 0.46 | 0.29 | 0.21 | 0.38 | 0.42 | 0.26 |
| PC2 | −0.07 | 0.44 | −0.30 | −0.16 | 0.20 | −0.44 | 0.35 | 0.17 | −0.55 | ||
| Symp | PC1 | 0.38 | 0.33 | −0.33 | 0.38 | 0.26 | 0.28 | 0.32 | 0.39 | 0.32 | |
| PC2 | 0.04 | −0.35 | 0.19 | 0.03 | −0.49 | 0.55 | −0.21 | 0.10 | 0.49 |
| Ca | K | Mg | S | P | Fe | Mn | Na | Zn | ||
|---|---|---|---|---|---|---|---|---|---|---|
| Location# | Infected Asymptomatic | |||||||||
| Field 1 | % difference * | 4 | 23 | 14 | −11 | −15 | −57 | 43 | 30 | 39 |
| p-value | 0.53 | 6 × 10⁻⁴ | 0.08 | 0.14 | 6 × 10⁻⁴ | 1 × 10⁻⁷ | 7 × 10⁻⁵ | 2 × 10⁻² | 6 × 10⁻³ | |
| Field 2 | % difference * | −40 | 11 | −34 | −5 | −10 | 51 | 50 | −34 | −34 |
| p-value | 6 × 10⁻³ | 0.10 | 2 × 10⁻³ | 0.59 | 0.11 | 6 × 10⁻³ | 2 × 10⁻³ | 0.14 | 4 × 10⁻³ | |
| Infected Symptomatic | ||||||||||
| Field 1 | % difference * | 21 | 35 | −1 | 4 | −23 | −52 | 41 | −3 | 8 |
| p-value | 2 × 10⁻² | 9 × 10⁻⁷ | 0.93 | 0.59 | 8 × 10⁻⁷ | 3 × 10⁻⁸ | 2 × 10⁻³ | 0.85 | 0.56 | |
| Field 2 | % difference * | −22 | 13 | −25 | −7 | −10 | 45 | 100 | −61 | −45 |
| p-value | 0.24 | 0.25 | 0.17 | 0.68 | 0.24 | 0.043 | 2 × 10⁻⁴ | 1 × 10⁻² | 2 × 10⁻³ | |
| Ca | K | Mg | S | P | Fe | Mn | Na | Zn | ||
|---|---|---|---|---|---|---|---|---|---|---|
| Field 1 | ||||||||||
| Leccino | % difference * | 19 | 9 | −12 | −9 | 3 | 10 | 2 | 79 | 2 |
| p-value | 2 × 10⁻² | 6 × 10⁻² | 1 × 10⁻¹ | 7 × 10⁻¹ | 5 × 10⁻² | 2 × 10⁻¹ | 8 × 10⁻¹ | 1 × 10⁻³ | 7 × 10⁻¹ | |
| Ogliarola salentina | % difference * | −3 | −1 | 2 | 0 | −12 | −1 | 4 | 139 | 31 |
| p-value | 7 × 10⁻¹ | 9 × 10⁻¹ | 8 × 10⁻¹ | 7 × 10⁻² | 9 × 10⁻¹ | 9 × 10⁻¹ | 7 × 10⁻¹ | 1 × 10⁻⁵ | 1 × 10⁻¹ | |
| Field 2 | ||||||||||
| Leccino | % difference * | 76 | −8 | 56 | 8 | 33 | 38 | 81 | 220 | 45 |
| p-value | 6 × 10⁻⁴ | 1 × 10⁻¹ | 1 × 10⁻² | 6 × 10⁻³ | 1 × 10⁻¹ | 7 × 10⁻³ | 1 × 10⁻⁴ | 7 × 10⁻⁵ | 5 × 10⁻³ | |
| Ogliarola salentina | % difference * | 37 | −10 | 36 | 8 | 36 | 44 | 36 | 449 | 72 |
| p-value | 1 × 10⁻¹ | 6 × 10⁻¹ | 9 × 10⁻² | 1 × 10⁻¹ | 7 × 10⁻¹ | 1 × 10⁻¹ | 7 × 10⁻² | 5 × 10⁻⁴ | 3 × 10⁻³ | |
| Field | Variety | Trees | Replicate Samples | Total Samples |
|---|---|---|---|---|
| Field 1 | Leccino | 10 | 5 inf. symptomatic–5 inf. asymptomatic | 100 |
| Ogliarola salentina | 10 | 5 inf. symptomatic–5 inf. asymptomatic | 100 | |
| Field 2 | Leccino | 4 | 5 inf. symptomatic–5 inf. asymptomatic | 40 |
| Ogliarola salentina | 4 | 5 inf. symptomatic–5 inf. asymptomatic | 40 | |
| Total | 28 | 280 |
© 2019 by the authors. Licensee MDPI, Basel, Switzerland. This article is an open access article distributed under the terms and conditions of the Creative Commons Attribution (CC BY) license (http://creativecommons.org/licenses/by/4.0/).
Share and Cite
D’Attoma, G.; Morelli, M.; Saldarelli, P.; Saponari, M.; Giampetruzzi, A.; Boscia, D.; Savino, V.N.; De La Fuente, L.; Cobine, P.A. Ionomic Differences between Susceptible and Resistant Olive Cultivars Infected by Xylella fastidiosa in the Outbreak Area of Salento, Italy. Pathogens 2019, 8, 272. https://doi.org/10.3390/pathogens8040272
D’Attoma G, Morelli M, Saldarelli P, Saponari M, Giampetruzzi A, Boscia D, Savino VN, De La Fuente L, Cobine PA. Ionomic Differences between Susceptible and Resistant Olive Cultivars Infected by Xylella fastidiosa in the Outbreak Area of Salento, Italy. Pathogens. 2019; 8(4):272. https://doi.org/10.3390/pathogens8040272
Chicago/Turabian StyleD’Attoma, Giusy, Massimiliano Morelli, Pasquale Saldarelli, Maria Saponari, Annalisa Giampetruzzi, Donato Boscia, Vito Nicola Savino, Leonardo De La Fuente, and Paul A. Cobine. 2019. "Ionomic Differences between Susceptible and Resistant Olive Cultivars Infected by Xylella fastidiosa in the Outbreak Area of Salento, Italy" Pathogens 8, no. 4: 272. https://doi.org/10.3390/pathogens8040272