Article

The Xylella fastidiosa-Resistant Olive Cultivar “Leccino” Has Stable Endophytic Microbiota during the Olive Quick Decline Syndrome (OQDS)

1
Department of Biological and Environmental Sciences and Technologies, University of Salento, Via Prov. le Monteroni, I-73100 Lecce, Italy
2
Federal Office for the Environment FOEN, Worblentalstrasse 68, CH-3063 Ittigen, Switzerland
3
Sustainable Agroecosystems, Institute of Agricultural Sciences, Department of Environmental Systems Science, ETH Zurich, Universitätsstrasse 2, CH-8092 Zurich, Switzerland
4
WSL Swiss Federal Research Institute, Zürcherstrasse 111, CH-8903 Birmensdorf, Switzerland
5
Department of Forest and Conservation Sciences, University of British Columbia, Vancouver, BC V6T 1Z4, Canada
*
Author to whom correspondence should be addressed.
Pathogens 2020, 9(1), 35; https://doi.org/10.3390/pathogens9010035
Submission received: 5 November 2019 / Revised: 20 December 2019 / Accepted: 23 December 2019 / Published: 31 December 2019
(This article belongs to the Section Plant Pathogens)

Abstract

:
Xylella fastidiosa is a highly virulent pathogen that causes Olive Quick Decline Syndrome (OQDS), which is currently devastating olive plantations in the Salento region (Apulia, Southern Italy). We explored the microbiome associated with X. fastidiosa-infected (Xf-infected) and -uninfected (Xf-uninfected) olive trees in Salento, to assess the level of dysbiosis and to get first insights into the potential role of microbial endophytes in protecting the host from the disease. The resistant cultivar “Leccino” was compared to the susceptible cultivar “Cellina di Nardò”, in order to identify microbial taxa and parameters potentially involved in resistance mechanisms. Metabarcoding of 16S rRNA genes and fungal ITS2 was used to characterize both total and endophytic microbiota in olive branches and leaves. “Cellina di Nardò” showed a drastic dysbiosis after X. fastidiosa infection, while “Leccino” (both infected and uninfected) maintained a similar microbiota. The genus Pseudomonas dominated all “Leccino” and Xf-uninfected “Cellina di Nardò” trees, whereas Ammoniphilus prevailed in Xf-infected “Cellina di Nardò”. Diversity of microbiota in Xf-uninfected “Leccino” was higher than in Xf-uninfected “Cellina di Nardò”. Several bacterial taxa specifically associated with “Leccino” showed potential interactions with X. fastidiosa. The maintenance of a healthy microbiota with higher diversity and the presence of cultivar-specific microbes might support the resistance of “Leccino” to X. fastidiosa. Such beneficial bacteria might be isolated in the future for biological treatment of the OQDS.

1. Introduction

The central role of the plant-associated microbiome in maintaining host’s fitness is being recognized more and more, and plants are now regarded as “holobionts”, which include the plant itself and the entire community of associated microbes, seen as a single unit of evolution [1,2]. The plant microbiome is known to be species- and cultivar-specific [3,4]; moreover, each plant habitat harbors its own specific microbiome [5]. Microorganisms interact with their host plants in several ways, from specific symbioses to relatively nonspecific beneficial effects, including plant growth promotion and protection from phytopathogens [6,7]. Like most plant species studied so far [8], olive (Olea europaea L.) has also an associated microbiome, which was shown to be cultivar-specific [9,10,11]. Being a tree species growing in arid and semiarid regions, olive might have established positive relationships with microbes to profit from several beneficial functions, including disease alleviation [12]. Indeed, microbes isolated from olive plants showed ability to inhibit phytopathogens, at least in in vitro assays [13]. In contrast with animals and humans, very little is known about the role of microbiome in plants and their response to plant diseases. Passos da Silva et al. [14] analyzed ten olive knots infected by Pseudomonas savastanoi pv. savastanoi and showed the presence of a highly diverse bacterial microbiota. However, they did not analyze P. savastanoi-uninfected plants as control, which makes it impossible to derive conclusions about the response of the native olive microbiome to the disease.
One of the most dramatic diseases for olive trees is the Olive Quick Decline Syndrome (OQDS), which resulted in devastation of thousands of hectares of plants in the Salento region, in Southern Italy), including very old trees [15,16], and infected more than twenty other plant species in the region [17]. Future projections suggested that the pathogen will persist in Europe [18]. It is caused by a strain (named “De Donno”, previously known as “CoDiRO”) of Xylella fastidiosa Wells et al., subsp. pauca, a xylem-limited bacterial pathogen transmitted in olive trees by sap-feeding insect vectors, i.e., the meadow spittlebug (Philaenus spumarius L.) [18]. X. fastidiosa can infect more than 550 plant species, including trees of major importance in forest ecosystems and urban greening plantations, such as oak, elm, sycamore, and maple, representing one of the major threats to agro-forest-ecosystems all over the world [19,20,21,22]. The pathogen invades the xylem, resulting in the occlusion of the vessels with subsequent restriction of water movement, inducing the related parts of tree crown to dry out [23,24,25,26]. To date, the most widespread olive cultivars in the Salento region, “Cellina di Nardò” and Ogliarola di Lecce, showed high sensitivity to X. fastidiosa, while a notable resistance was observed in the less common cultivar “Leccino” [27,28,29].
The mechanisms of resistance of the “Leccino” trees are still unclear. It was previously shown that “Leccino” resistance is probably influenced by the lignin amount in the xylem vessels, which can limit the bacteria movement and the host invasion by slowing down the disease progression [30], or by the constitutive amount of secondary metabolites such as hydroxytyrosol glucoside [29]. However, in a citrus plant or grapevine affected by X. fastidiosa, it was shown that the nature of the endophytic bacterial community is able to downregulate the pathogen growth or plant symptoms, either because they compete with the pathogen or because they secrete substances able to modulate its virulence [31,32]. The first results on olive tree microbiome were recently released, and they indicated that a very high proportion of the detected fungi occurs in the resistant cultivar FS17 [33].
Microbial diversity is associated with plant health and productivity [34,35], similarly to the gut microbiome in humans [36]. It is possible that the autochthonous microbiome associated with “Leccino” trees contributes to its resistance to X. fastidiosa, for example, by inhibiting the pathogen via microbe–microbe interactions or by triggering the reaction of the plant immune system. This interaction could synergistically enforce the natural resistance of “Leccino” trees to this pathogen.
In this study, we explored and compared the autochthonous fungal and bacterial microbiota associated with both X. fastidiosa-infected (Xf-infected) and -uninfected (Xf-uninfected) “Leccino” trees (X. fastidiosa-resistant), using the X. fastidiosa-susceptible “Cellina di Nardò” trees as a control. Our aims were as follows: (i) to assess differences in terms of assemblage, diversity, and structure between the two cultivars; (ii) to understand the response of the native microbiota to the X. fastidiosa infection; and (iii) to identify taxa specifically associated to the cultivar “Leccino”. Moreover, we explored the microbial co-occurrence/co-exclusion network within the endophytes of Xf-infected “Leccino”, to gain insights into the multispecific interactions involving X. fastidiosa. We hypothesized the following: (i) the cultivar “Leccino” harbors specific microbiota, with a different assemblage and a higher diversity compared to “Cellina di Nardò”; (ii) the response of the olive microbiota to X. fastidiosa infection is different between the two cultivars; (iii) microbial taxa exist that are maintained, or that appear only, during X. fastidiosa infection in “Leccino” but not in “Cellina di Nardò”; and (iv) these “Leccino”-specific taxa show potential multispecific interactions with X. fastidiosa.

2. Results

2.1. 16S rRNA Gene and ITS2 Illumina Sequencing Output

A total of 4,548,524 raw sequences were obtained from the 16S rRNA gene amplicon libraries after joining the paired ends, from 78 of the 80 samples (two samples did not give a sequencing output). After length and quality filtering, a total of 4,534,886 sequences remained, of which 4,337,856 (95.7%) were identified as non-chimeric. They were grouped into 21,358 OTUs at 97% sequence similarity threshold. After removal of mitochondrial, plastidic, unassigned OTUs, and OTUs with less than 10 reads, 881 OTUs remained, representing a total of 3,944,950 sequences (2806–121,289 sequences per sample, with an average of 50,576.3 ± 28,172.1; Table S1).
The ITS2 amplicon libraries produced a total of 3,536,039 raw sequences from 76 of the 80 samples (four samples did not give a sequencing output), after joining the paired ends. After length and quality filtering, a total of 2,868,275 sequences remained, of which 2,753,359 were identified as non-chimeric and 2,753,353 (96.0%) were extracted as ITS2. They were grouped into 6039 OTUs at 97% sequence similarity threshold. After removal of unassigned OTUs, metazoan OTUs and OTUs with less than 10 reads, 1006 OTUs remained, representing a total of 2,620,425 sequences (384–104,659 sequences per sample, with an average of 34,479.3 ± 28,405.5; Table S1).
Before proceeding with the sequence analysis, five 16S rRNA gene samples and nine ITS2 samples were eliminated because of the lower number of reads in order to increase the sequencing depth at the rarefaction step (11950 reads for Bacteria and 4850 for Fungi), thus optimizing the per-sample coverage. However, the statistical design was nor unbalanced, since for each type of sample (Cultivar × Habitat × Microbiota × Infection status) three to five biological replicates remained (Table S2), thus allowing a full factorial statistical analysis for both Prokaryotes and Fungi. After removal of these samples, the number of OTUs was reduced to 875 for Bacteria and 974 for Fungi. The sequences were submitted to EMBL (www.ebi.ac.uk/ena) under the project number PRJEB32050.

2.2. Sequence Analysis

For all samples, Good’s coverage was >99.5% for Prokaryotes (average = 99.84%) and >98.7% for Fungi (average = 99.57%) (Figure S1), demonstrating that most of the samples’ microbial diversity was captured.
The taxonomic assignment of the prokaryotic OTUs revealed 14 phyla, 25 classes, 66 orders, 98 families, and 184 genera (Table S3), all of them bacterial (Archaea were not detected). The most dominant phylum was Proteobacteria with an average relative abundance per sample of 76.0%, followed by Firmicutes (16.9%), Bacteroidetes (3.8%), and Actinobacteria (2.8%). The remaining phyla (Planctomycetes, Chloroflexi, Verrucomicrobia, Acidobacteria, Patescibacteria, Cyanobacteria, Chlamydiae, Armatimonadetes, Candidate division FBP, and Nitrospirae) accounted for a total of 0.49%. The most abundant families were Pseudomonadaceae (56.2%) and Paenibacillaceae (14.8%) (Table S3). The ten most abundant OTUs accounted for 83.9% of all sequences, and the 30 most abundant ones accounted for 92.4% (Figure 1A). All samples were dominated by Pseudomonas, related to the species P. aeruginosa, (98.7%), P. stutzeri (98.9%) and, at a less extent, P. taiwanensis/monteilii/knackmussii/juntendi (98.7%), except the Xf-infected “Cellina di Nardò” samples that were dominated by Ammoniphilus (Figure 1A). X. fastidiosa was the 10th most abundant taxon. It was detected in all “Leccino” Xf-infected samples (Figure S2), where it was present in 16 out of 20 individual samples (Figure 1A; Table S3), and in the Xf-infected “Cellina di Nardò” samples only within the endophytic community (Figure S2), where it appeared rather erratic among the individual samples (Figure 1A).
The taxonomic assignment of the fungal OTUs revealed 5 phyla (one of which remained unidentified), 26 classes, 63 orders, 142 families, and 241 genera (Table S4). The most dominant phylum was Ascomycota, with an average relative abundance per sample of 84.4%, followed by Basidiomycota (11.5%) and unidentified (4.1%). The most abundant families were Hypocreales_fam_Incertae_sedis (45.8%) and Aureobasidiaceae (7.3%) (Table S4). The ten most abundant OTUs accounted for 64.7% of all sequences, and the 30 most abundant ones accounted for 81.8% (Figure 1B). All endophytic communities of both cultivars appeared very similar, with dominant Acremonium and Sarocladium (Figure 1B). Total community (epiphytes + endophytes) appeared very similar between Xf-infected and -uninfected “Cellina di Nardò” samples, with marked differences between habitats (leaves and branches); branches looked similar to the endophytic communities, while, in leaves, Aureobasidium and Capnodiales prevail (Figure 1B). “Leccino” showed a clearly different fungal community in both Xf-uninfected leaves and branches (with dominant Trametes and Lecidella, respectively) compared to “Cellina di Nardò”. However, the Xf-infected “Leccino” looked very similar to the Xf-infected “Cellina di Nardò” (Figure 1B).
Alpha-diversity metrics (Shannon diversity and equitability) of the endophytes were lower when compared to the total community for both fungi and bacteria, as expected (p < 0.001; Figure 2). “Leccino” showed a higher bacterial diversity than “Cellina di Nardò” (p < 0.001) (Figure 2A), while, for fungi, this difference was strongly reduced (p = 0.044) (Figure 2B). Habitat and infection status also affected the bacterial diversity significantly, with higher indices found in leaves (p < 0.001) and in Xf-infected samples (p = 0.018), respectively. Both factors did not significantly affect fungal diversity instead (p = 0.11 and 0.056, respectively). Significant interactions for bacteria were Cultivar*Infection status (p = 0.007) and Cultivar*Habitat (p = 0.003). For fungi, also, the same interactions were significant (p = 0.014 and p < 0.001, respectively), as well as Cultivar*Infection status*Habitat (p < 0.001). Interestingly, Xf-uninfected “Leccino” showed a notably higher bacterial diversity compared to the corresponding Xf-uninfected “Cellina di Nardò”, for both total community and endophytes (Figure 2A). In the case of fungi, this difference appeared only in branches but not in leaves (Figure 2B). The Equitability index followed the same trend as the Shannon index.
Beta-diversity analysis was performed with Bray–Curtis dissimilarities. The global score-heatmap clearly showed that the bacterial microbiota of Xf-infected “Cellina di Nardò” plants was the most different from all the other ones, especially the leaf endophytic microbiota (Figures S3 and S4A). In contrast, the Xf-infected “Leccino” samples maintained a higher similarity with the Xf-uninfected samples in the case of the endophytic microbiota (Figures S3 and S4A). This trend was not observed for the fungal microbiota (Figures S5 and S4B). Total microbiota (epiphytes + endophytes) and endophytes were then separately plotted (PCoA plots, Figure 3) and analyzed for significance of factors. The structure of the total bacterial microbiota was significantly different between Xf-infected and -uninfected plants (Adonis test, p < 0.001) (Figure 3A; Table 1). However, the separate analysis of each cultivar showed that only the “Cellina di Nardò” microbiota was strongly affected by the infection status, while Xf-infected “Leccino” samples did not differ significantly from the Xf-uninfected “Leccino” (p = 0.067; Table 1). The same trend was observed for the endophytes, where the difference of the two cultivars was even clearer: all samples clustered together except the Xf-infected “Cellina di Nardò” (Figure 3B). The effect size of the factor “infection status” was very large here, as it can be appreciated by drawing the plot according to a proportionated axes scale (Figure 3C). Separate testing of branches and leaves showed that the endophytic microbiota of the leaves of “Leccino” had a particular stability to the X. fastidiosa infection (Adonis p = 0.429 for the factor “infection status” of “Leccino” leaves’ endophytes; Table 1). In general, the bacterial microbiota was significantly different between “Leccino” and “Cellina di Nardò” cultivars (Table 1). However, this difference was much more pronounced for Xf-infected (p < 0.001) than for Xf-uninfected plants (p = 0.04). Indeed, analyzing separately Xf-uninfected branches and leaves, no difference was found between endophytes of “Cellina di Nardò” and “Leccino” (p > 0.1 for the factor “cultivar”; Table 1). The total fungal microbiota showed an opposite behavior (which was indeed evident already after identification of the dominant OTUs, Figure 1B): samples clustered according to habitat but Xf-uninfected “Leccino” branches and leaves were clearly different from other samples (Figure 3D).
However, Xf-infected “Leccino” branches and leaves showed the same structure than “Cellina di Nardò” plants (Figure 3D). Therefore, only a low significant effect of the infection status was found between all samples (p = 0.024), which was due only to “Leccino” (p < 0.001), while “Cellina di Nardò” Xf-infected and -uninfected samples did not differ (p = 0.069) (Table 1). In the case of fungal endophytes (Figure 3E), no clear pattern could be identified, as confirmed by the generally not significant Adonis p-values (Table 1).

2.3. Identification of Significant Taxa

Considering the results of the beta-diversity analysis, which indicated that the bacterial microbiota is similar between Xf-infected and -uninfected “Leccino” trees, while it is significantly different between Xf-infected and -uninfected “Cellina di Nardò” trees (Table 1 and Figure 3B,C), the identification of significant taxa was focused on bacteria only. Between Xf-infected “Leccino” and “Cellina di Nardò” endophytic bacterial microbiota, four phyla were significantly different (White’s test, FDR-corrected p < 0.05): Firmicutes were more abundant in “Cellina di Nardò” Xf-infected samples, while Proteobacteria, Bacteroidetes and Actinobacteria were more abundant in “Leccino” (Figure 4A). Six genera were enriched in Xf-infected “Cellina di Nardò”, and the dominant of which was by far Ammoniphilus (Figure 4B). Nine genera were enriched in “Leccino” samples instead, the most abundant of which was Pseudomonas (Figure 4B).
To identify taxa potentially involved in the resistance of “Leccino” to X. fastidiosa, we compared Xf-infected and -uninfected, “Leccino” and “Cellina di Nardò” cultivars (endophytes only). Seven bacterial families showed a significantly different distribution among the groups (Kruskal–Wallis test, FDR-corrected p < 0.05); their clustering showed how “Cellina di Nardò” Xf-infected samples clustered apart (Figure 5A). Seventeen genera were significantly different; in particular, Allorhizobium–Rhizobium–Pararhizobium–Rhizobium, Massilia, Enterobacter, Sphingomonas, and an unidentified Burkholderiaceae genus were found only in Xf-infected and -uninfected “Leccino” (Figure 5B–F).
Pseudomonas and Sediminibacterium were present also in Xf-uninfected “Cellina di Nardò” but significantly reduced or disappeared after X. fastidiosa infection. In “Leccino”, instead, they persisted also in Xf-infected plants (Figure 5G,H). Silanimonas and an unidentified Xanthomonadaceae genus were detected only in Xf-infected “Leccino” (Figure 5I,J). X. fastidiosa was also significantly different between groups, being more abundant in Xf-infected “Leccino” (Figure 5K; Figure S2). Ammoniphilus and Bacillus characterized the “Cellina di Nardò” Xf-infected samples (Figure 5L,M).

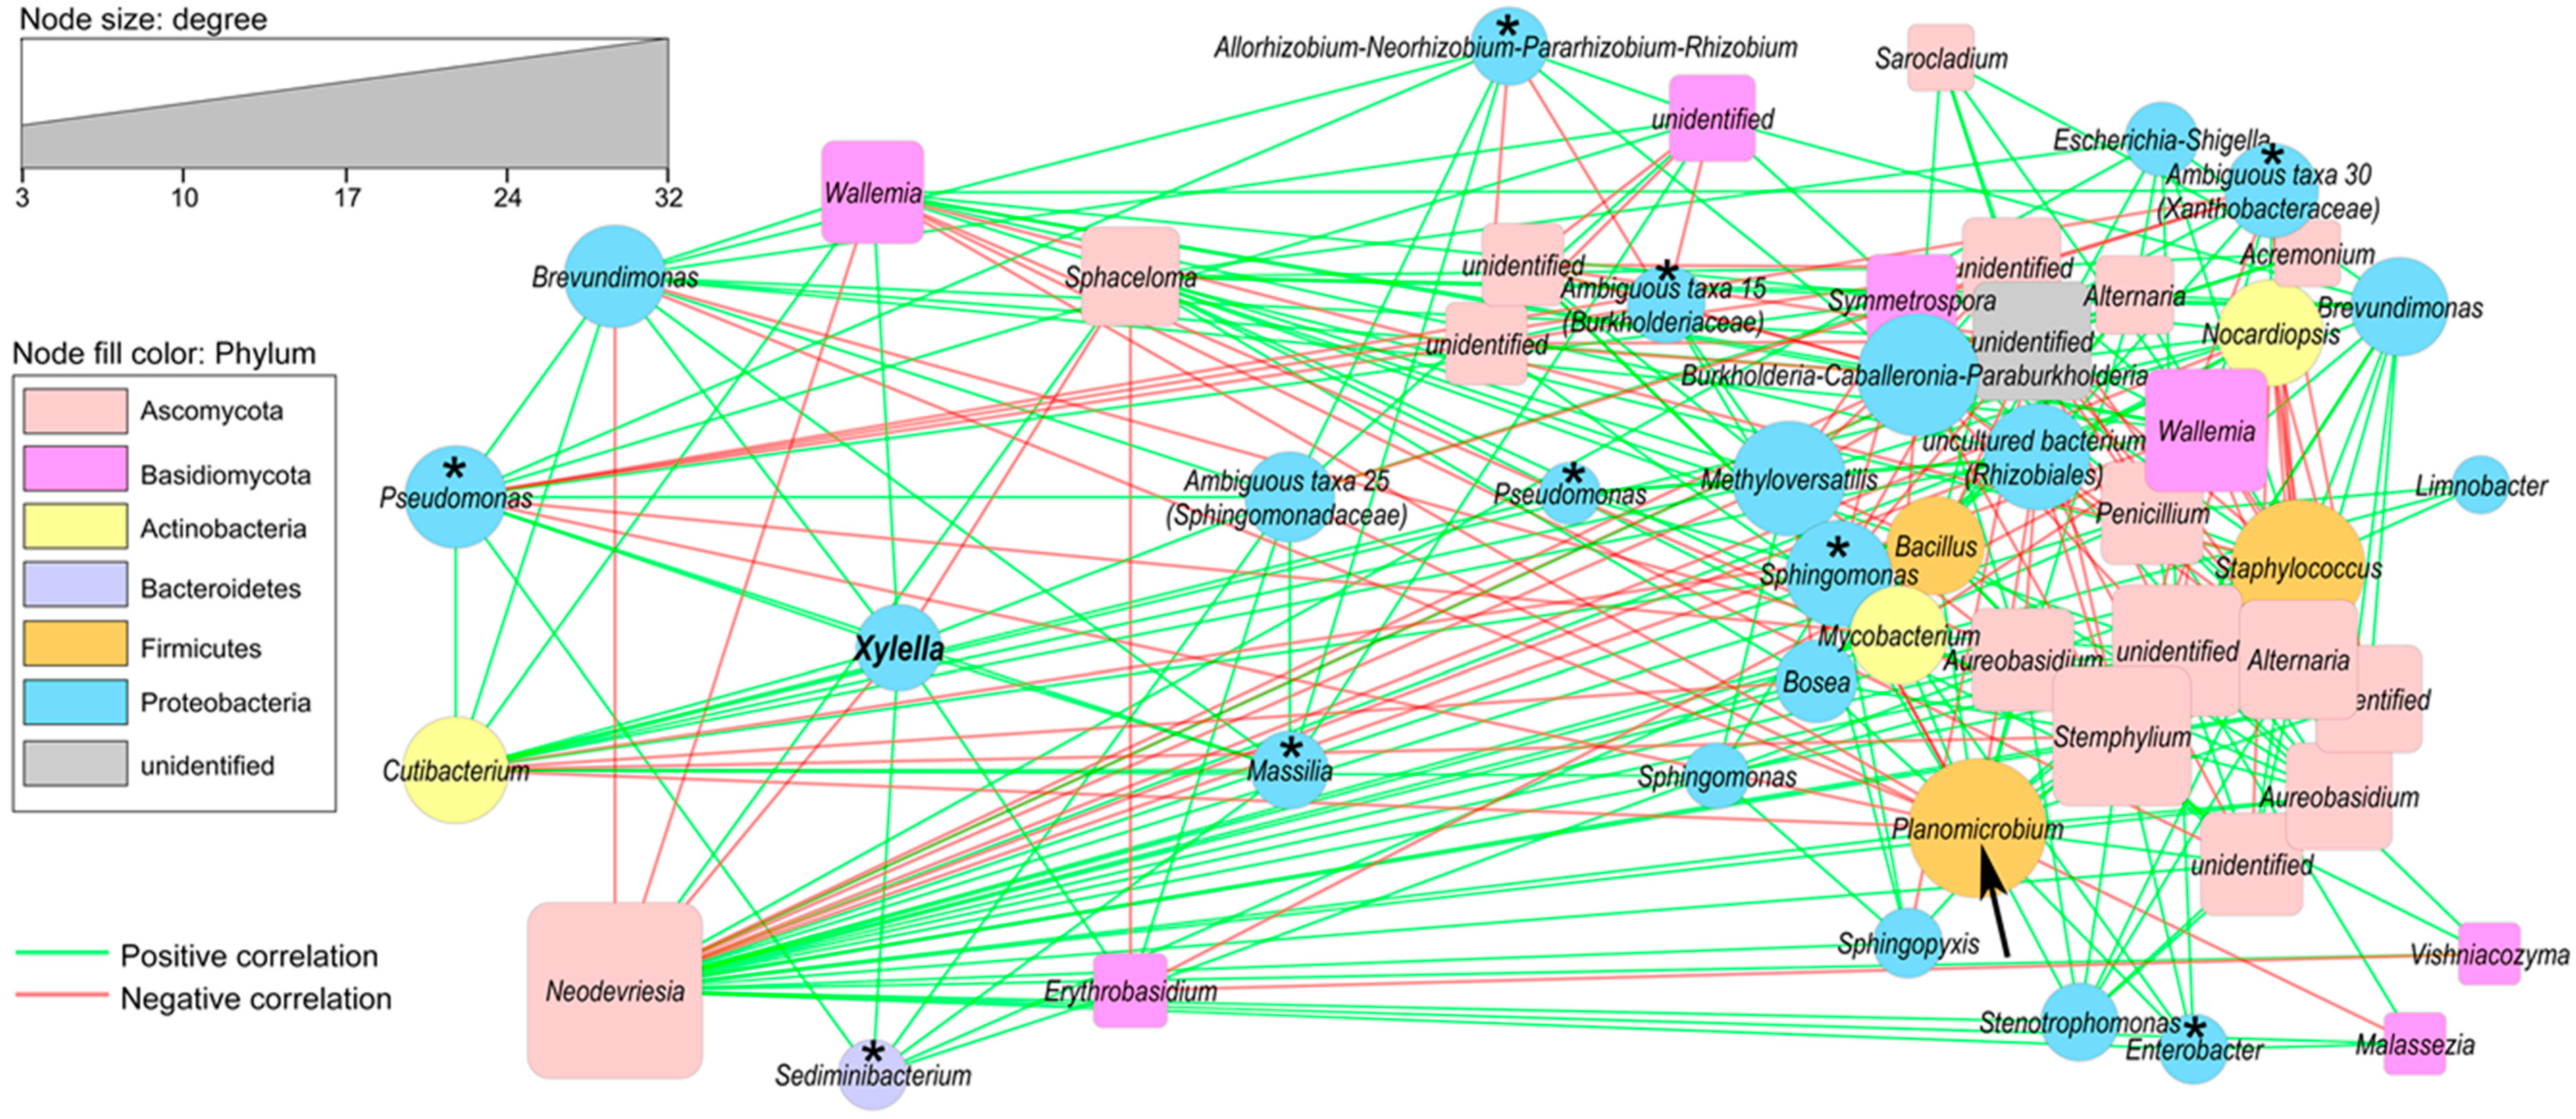
2.4. Correlation of Co–Occurrence Patterns and Network Analysis

To identify taxa potentially interacting with X. fastidiosa within the leaf endophytic microbiota of Xf-infected “Leccino” leaves, we created a network based on correlation of co-occurrence patterns [37].
Out of 43 bacterial and 47 fungal OTUs that passed the minimum abundance thresholds, 28 and 24 showed at least one potential interaction. There were 225 positive and 192 negative interactions that were supported by at least three of the four correlation and distance methods computed (Figure 6). There was no significant difference in the average degree per OTU (number of connections) between fungi and bacteria (t-test, p = 0.30). X. fastidiosa was directly interacting with 10 OTUs (six bacterial and four fungal), showing eight positive and two negative interactions (in order to facilitate interpretation of the network, we arranged the X. fastidiosa-cluster separately with a circular layout; however, the original network can be seen in Figure S6). The fungal OTUs identified as Sphaceloma and Neodevriesia showed co-exclusion with X. fastidiosa; however, they were not significantly different between cultivars (FDR-corrected p > 0.1). Interestingly, several OTUs belonging to the bacterial genera that were found to be significantly associated with “Leccino” (Figure 5B–J), were found interacting (directly or indirectly) with X. fastidiosa (Figure 6, asterisks). “Hub” OTUs, i.e., important taxa identified according to degree and betweenness centrality values were the fungal OTU Neodevriesia and the bacterial OTU Planomicrobium (Figure 6, arrow); the latter showed an association trend to “Leccino” similar to the other “Leccino”-specific taxa (Figure S7), although not significant (FDR-corrected p = 0.12); however, g-test of independence indicated that, also, this OTUs was non-randomly distributed between Xf-infected cultivars (FDR-corrected p < 0.001).

3. Discussion

In this work, we aimed to characterize the microbiota associated with the X. fastidiosa-resistant olive cultivar “Leccino”, a highly promising cultivar able to survive and grow in Salento despite the severe X. fastidiosa outbreak that affects this region of Italy since several years [38]. So far, no effective method was found to control the pathogen [22,39,40], but only several conventional and innovative diagnostic approaches were tested for the De Donno strain [28,41,42]. It is of primary importance to understand the basic resistance mechanisms of “Leccino”, in order to implement successful agronomical strategies to overcome the current critical situation of the disease. The working hypothesis of this study was that the autochthonous microbiota associated with the cultivar “Leccino” plays a role in the cultivar’s resistance to X. fastidiosa, perhaps acting synergistically with the plant’s own resistance mechanisms, as suggested for the olive cultivar FS17 [33]. Plant microbiomes are species- and cultivar-specific, and therefore the final desired goal of our research is to identify microbial species or consortia, specifically associated to “Leccino” that could be used for the biological control of the Olive Quick Decline Syndrome. First, we characterized the microbiome associated with branches and leaves of the cultivar “Leccino”. To do this, we applied a cultivation-independent approach (Illumina sequencing) and used an X. fastidiosa-susceptible cultivar (“Cellina di Nardò”) as control for comparison. Our sampling strategy followed a full factorial scheme, including the separation of endo + epiphytic microbiota and endophytic only (by surface-sterilizing a subset of samples), the differentiation between branches and leaves, and the analysis of Xf-infected and -uninfected plants. Both Prokaryotic and Fungal microbiota were analyzed. To the best of our knowledge, no data have been available so far in the literature on the total microbiome associated with Xf-infected and Xf-uninfected olive trees in Salento.
The Xf-infected and -uninfected samples of our study were collected from two areas within the same natural park, at 3 km distance from each other. This was a strategical choice, due to the higher risk to select false-negative samples in orchards in which positive plants were previously detected compared to sampling in orchards in which the pathogen was not yet ascertained. This event is not uncommon for an erratically distributed pathogen with a long period of latency [22]. However, the sampling area is flat, without surrounding or dividing orographic elements, which might influence notably the average weather conditions (Table S5). Although some micro-climatic conditions of the sampling sites (difficult to track) might have influenced the olive-associated microbiome, soil analysis showed largely similar pedological parameters (Table S6). Thus, pedo-climatic conditions can be reliably considered as homogeneous within the whole sampling area.
Our samples showed an erratic distribution of X. fastidiosa, especially in the branches, confirming previous reports [25,26,41]. The taxonomic composition of the microbiota showed hundreds of families and genera, which is in agreement with the data available from other tree species [43,44]. Dominant organisms were typical plant-associated taxa, also known to be endophytic, such as Pseudomonas, Sphingomonas, and Methylobacterium among bacteria, and Acremonium, Aureobasidium, and Sarocladium, among fungi. Interestingly, Archaea were not detected, although the primers used in this work are able to amplify archaeal 16S rRNA genes [44]. Müller et al. [9] analyzed the leaf microbiota of 10 O. europaea cultivars from the Mediterranean basin, including “Leccino”, and found abundant Archaea in all of them. However, these plants were all grown at a single agricultural site in Spain, and therefore this abundance might have been determined by the local soil and environmental conditions.
In our study, Xf-infected “Cellina di Nardò” samples appeared severely dysbiotic, especially for the leaf endophytic bacteria. Here the endophytic bacteria were dominated by Ammoniphilus, an obligate oxalotrophic bacterium that requires high concentration of ammonium to grow [45]. To the best of our knowledge, its presence in diseased plants has never been shown until now. Likely, its abundance in the Xf-infected “Cellina di Nardò” is linked to the advanced status of the disease in our samples, where high amount of ammonium might have accumulated due to tissue decay. The nitrogen level in the soil where Xf-infected plants grew is good (1.92 g kg−1); however, it is unlikely that a high concentration of ammonium in plant tissues could have derived directly from soil nitrogen, otherwise we would have observed a prevalence of Ammoniphilus also in the Xf-infected “Leccino” samples. Xf-infected “Leccino”, instead, showed a bacterial assemblage and structure similar to that of the Xf-uninfected samples, and this was particularly evident for the leaf endosphere. Considering that this is the primary site of X. fastidiosa infection, the stability of the endophytic microbiota in the leaves of Xf-infected “Leccino” appears very relevant and promising for the biological control of X. fastidiosa. Dysbiosis is the unbalanced microbial status associated to several diseases in humans and animals [46,47]. However, little is known about the equivalent situation in plants, and this is one of the first reports showing dysbiosis associated to a plant disease. We argue that the stability of the endophytic microbiota of “Leccino” during X. fastidiosa infection contributes to the maintenance of a good healthy status of the plant. In fact, it is known that the plant microbiome provides several ecological services important for the maintenance of the host’s fitness and health [48], within the concept of the “plant holobiont” [2,49], as it was shown, for example, in the case of the tomato var. Hawaii 7996’s resistance to Ralstonia solanacearum [50]. Moreover, the endophytes are expected to establish a more intimate relationship with the host than the epiphytes [8,51]. As such, the bacterial species forming the leaf endophytic microbiota of “Leccino” might be a promising source of strains with potential biocontrol activity against X. fastidiosa.
The microbiota of “Leccino” also showed a higher diversity and equitability with respect to those of “Cellina di Nardò”. Again, this difference was especially evident for bacteria of both, endo + epiphytic and endophytic microbiota (Figure 2). Microbial diversity was linked to the health and fitness of ecosystems in general [52,53] and plants in particular [54,55]. A well-balanced microbiome supports a series of functions that turns beneficial to the host, including the production of inhibitory compounds and growth-promoting factors, and can provide a “barrier effect” that limits both space and nutrients for potential alien species’ and pathogens’ growth [6]. We suggest that the more diverse “Leccino” microbiota reduces the effects of X. fastidiosa infection or modifies its output effect for the plant.
The total fungal microbiota appeared very diverse, but no clear difference could be seen in the Xf-infected samples (Figure 3D). The endophytic fungal community did not show clear distinguishable pattern between the two cultivars, and therefore we concentrated our analysis on the bacterial microbiota. A statistical comparison between the microbiota of the two cultivars indicated that some bacterial species occurred only in “Leccino”, either in both, Xf-infected and -uninfected plants, or only in the Xf-infected ones. These “Leccino”-specific taxa include species known to exert beneficial effects on the host plants, such as Rhizobium [56], Burkholderiaceae [57], Sphingomonas [58], and Enterobacter [59]. Massilia is a genus recently shown to be involved in plant-microbe interactions at root and rhizosphere level [60,61]; however, it was never shown so far in the plant endosphere or phyllosphere. Pseudomonas and Sediminibacterium were reduced in Xf-infected “Cellina di Nardò”, while the former is a very well-known plant beneficial genus [62], the latter is a typical sediment bacterium that was never shown associated to plants or beneficial. Although the genus Pseudomonas includes some phytopathogenic species (such as the mentioned P. savastanoi pv. savastanoi), in our study the detected Pseudomonas OTUs were taxonomically related mainly to different species, such as P. aeruginosa, P. stutzeri and, at a less extent, other Pseudomonas spp. (BLAST analysis of representative sequences). We hypothesize that these “Leccino”-specific taxa could interact with X. fastidiosa in “Leccino”, and therefore the next step was to perform a co-occurrence analysis to assess potential interactions in the endophytic microbial network.
Microbe–microbe interactions can change the net effect of a microbiome on the host, including plants [63] and animals [64]. Therefore, it is of primary importance to investigate microbial interactions also between uncultivated species, which represent the majority [65,66]. Inference of co-occurrence networks is a computational method able to detect potential interactions between microbes based on their relative abundances in the samples [36]. This method is increasingly used to characterize the plant-associated microbiota, for example, in the rhizosphere [61,67,68,69] or in the pollen habitat [70]. Here we showed that X. fastidiosa is potentially interacting with several species of bacteria and fungi in the leaf endosphere of Xf-infected “Leccino”. Although we were particularly interested in negative correlations, which could indicate a direct inhibition of X. fastidiosa, the positive correlations could point to beneficial species that grow together with the pathogen (therefore being positively correlated) but at the same time modify its metabolism and reduce its pathogenicity. To perform this analysis we used only the endophytic samples from “Leccino” (and excluded ones of “Cellina di Nardò”) for two reasons: First, X. fastidiosa was consistently detected only in “Leccino” (Figure 1A; Figure S2); second, the microbiota of Xf-infected “Cellina di Nardò” was so different, due to the dysbiosis, that the network would have been strongly biased by the “habitat filtering” effect [36], which would make network interpretation impossible [71]. On the other hand, as a consequence, the number of samples used for the co-occurrence analysis in our work was relatively low, which is a critical point in co-occurrence network inference [71]. In the future, a wider analysis of the endophytic leaf microbiota from Xf-infected “Leccino” trees should be done, to perform a more robust co-occurrence correlation analysis and confirm our results.
“Cellina di Nardò” Xf-infected samples in our study showed a low presence of X. fastidiosa. This was probably due to the fact that we sampled plants at a very advanced disease state, when the pathogen could become very erratic [72]. The putative lower amount of X. fastidiosa observed in 2018 in susceptible cultivar compared to resistant one should be likely due to the progression of symptoms, which became very severe in “Cellina di Nardò” trees in 2018, causing an adverse habitat for the pathogen. Moreover, the advanced state of disease in the Xf-infected “Cellina di Nardò” plants might have had an effect on the whole microbiome. However, to analyze such plants was a strategic decision because we aimed to have certainly Xf-infected olive trees as control to be compared to the resistant “Leccino” trees, which are definitively the subject of this work. To assess the actual effect of the disease status on the whole microbiome, an analysis of susceptible olive cultivars at different disease stages will be necessary, in order to investigate the dynamic of the dysbiosis and to link it to the general infection status of the tree.

4. Methods

4.1. Sample Collection

Olive trees of cultivars “Leccino” and “Cellina di Nardò” were sampled in spring 2016–2018 in productive orchards located close to the town of Lecce in Apulia (Southern Italy) (Parco Naturale Regionale Bosco e Paludi di Rauccio, 40°27′24.0″ N–18°09′43.8″ E, Apulia, Italy).
Olive trees showing symptoms of OQDS were grown in neighboring “Leccino” and “Cellina di Nardò” orchards. Asymptomatic plants were grown in neighboring orchards of both cultivars, at a distance of about 3 km from the symptomatic plants’ orchards. The two sampling areas lie on a flat region without dividing or surrounding orographic elements (hills, rivers, etc.), with an even climate (Table S5). Physicochemical soil parameters of the two sampling areas were performed, and resulted largely similar (Table S6). Plants to be sampled were selected according to similar age (25–35 years), comparable disease status, same agronomic practices in the last 3 years (including pest control, according to both, recommendations for protected areas of the region [73] and phytosanitary treatments (EU Decision 2015/789).
The presence of X. fastidiosa was assessed by real-time PCR [74] in 2016–2018 (see section below). The selected plants were monitored for some of the most common pathogens in addition to X. fastidiosa, checking for symptoms caused by natural infection of Spilocaea oleaginea and Pseudomonas savastanoi pv. savastanoi during the 12 months before sampling. According to [72], the presence of symptoms of olive peacock spot and olive knot were scored singularly using a severity scale (0 = symptomless; 1 = symptoms on few branches (≤5); 2 = symptoms on several branches (>5); and 3 = symptoms uniformly distributed throughout the canopy). In addition, diagnostic tests (real-time PCR) were carried out on leaves or woody section, according to protocols reported in the literature, for Botryosphaeria dothidea [75], Colletotrichum spp., C. acutatum and C. gloeosporioides [76], Diplodia seriata [77], Phaeomoniella chlamydospore [78], Phaeoacremonium aleophilum, and P. parasiticum [79,80], Phytophthora spp. [81], and Verticillium dahliae [82].
To carry out the endophytic analysis on homogeneous trees, both X. fastidiosa positive and negative plants (5 plants per cultivar/infection status) were selected according to lower severity (= 1) for P. savastanoi pv. savastanoi (plants without symptoms of olive knot were not available in the area) and negative response to diagnostic test for the other pathogens (Table S7). However, P. savastanoi pv. savastanoi is not a systemic pathogen; thus the wood and leaves sampling for endophytic analysis were carried out on branches without olive knot symptoms in order to avoid interactions with X. fastidiosa.
Each biological replicate consisted of pooled branches or leaves collected from a single tree. In detail, every branches’ sample consisted of cross-sections without bark of pooled pieces (0.5 cm length), while each leaf sample consisted of a pool of 25 leaves.
Samples were named according to the following identification code: first letter = cultivar (L or C, i.e., “Leccino” or “Cellina di Nardò”); second letter = infection status (I or H, i.e., Xf-infected or -uninfected); third letter = habitat (B or L, i.e., Branches or Leaves). A progressive number from 1 to 5 was added to identify the replicate. The prefix “Endo” was added to the samples that were subsequently surface-sterilized, to analyze the endophytic microbiota only. Examples: Endo-LHB-1 = the first replicate of “Leccino” Xf-uninfected branches, endophytes; CIL-2 = the second replicate of “Cellina di Nardò” Xf-leaves, total microbiota (epiphytes + endophytes). In total, 80 samples were analyzed: 2 cultivars*2 infection status (Xf-infected vs. -uninfected)*2 plant habitats (branches or leaves)*2 community type (epiphytic + endophytic vs. endophytic only)*5 replicates, according to a full-factorial scheme.
For the surface sterilization, the following protocol was used: 75% EtOH for 1 min, 4% NaOCl for 5 min, and 75% EtOH for 30 sec.

4.2. DNA Extraction, PCR, and Illumina Sequencing of 16S rRNA Gene and ITS2 Amplicon Libraries

Plant tissue from each sample (approximately 1 g of leaf petioles and branches) was transferred into an extraction bag (BIOREBA, Switzerland) and 4 mL of extraction buffer (0.2 M of Tris–HCl pH 9, 0.4 M of LiCl, and 25 mM of EDTA) were added. Sample homogenization was performed by using a semi-automatic homogenizer (Homex 6, BIOREBA, Switzerland) at 50% maximum speed. DNA extraction was performed according to Edwards et al. [83] with some modifications. In this protocol, the DNA solution is first extracted with a phenol/chloroform/isoamyl alcohol (25:24:1) mixture, to remove protein contaminants, and then precipitated with 100% isopropanol.
The isolated DNA was used as template for X. fastidiosa detection by TaqMan real-time PCR protocol with XF-F/R primers and XF-P probe [74]. Reactions were performed in a real-time thermal cycler (ABI PRISM 7900HT, Applied Biosystems, USA). Each reaction consisted of 5 μL from a 20 ng μL−1 dilution of DNA extracted from 1 g of leaf petioles or branches, 12.5 μL of Master Mix (Applied Biosystems), 400 nM of forward and reverse primers, 200 nM of TaqMan probe, and ultrapure DNase/RNase-free water (Carlo Erba Reagents S.r.l., Italy) in a total volume of 25 μL. The cycling conditions were as follows: an initial denaturation step at 95 °C for 10 min, followed by 40 cycles of 95 °C for 15 s and 60 °C for 1 min, with the final dissociation at 95 °C for 15 s, 60 °C for 30 s, and 95 °C for 15 s. All symptomatic and asymptomatic plants were singularly tested each year (2016–2018). Trees were considered Xf-uninfected when leaf samples were negative to every X. fastidiosa assay carried out in 2016-2018. In regard to Xf-infected plants, X. fastidiosa concentration from “Leccino” and “Cellina di Nardò” samples were inferred by the standard calibration curve, using Cqs from qPCR as described by [84] (Table S7).
The extracted DNA was also used as the template to perform a two-step amplification protocol in which the core PCR primer and the adaptors CS1 (forward) and CS2 (reverse) were included in a single oligonucleotide at the 5′ end of each primer to allow multiplexing with the Fluidigm Access Array System (Fluidigm, South San Francisco, CA, USA). The oligonucleotide sequences were (core PCR primer in bold) 5.8S-Fun (5′-ACACTGACGACATGGTTCTACA-AACTTTYRRCAAYGGATCWCT-3′) and ITS4-Fun (5′-TACGGTAGCAGAGACTTGGTCT-CCTCCGCTTATTGATATGCTTAART-3′) [85] for fungi, 341F (5′-ACACTGACGACATGGTTCTACA-CCTAYGGGDBGCWSCAG-3′) and 806R (5′-TACGGTAGCAGAGACTTGGTCT-GGACTACNVGGGTHTCTAAT-3′) for prokaryotes [86]. A mixture of peptide nucleotide acid (PNA) blockers oligos (PNA Bio Inc., Thousand Oaks, CA, USA) targeted at plant mitochondrial and plastidic genomes was added, to increase the fraction of bacterial sequences, reduce the PCR-bias, and thus result in more accurate sequencing [86,87].
Briefly, the PCR was carried out in 25 µL of reaction mixture, using 50 ng of DNA, 12.5 µL 2× PCR master mix (EmeraldAmp® GT PCR Master Mix, Takara Bio, Inc., Japan), 1.0 µL FWD primer (0.2 µM), 1.0 µL REV primer (0.2 µM), 1.25 mPNA blocker (0.25 µM), 1.25 pPNA blocker (0.25 µM), and ultrapure DNase/RNase-free water (Carlo Erba Reagents S.r.l., Italy) to final volume of 25 µL. PCR was performed in 2720 Thermal Cycler (Applied Biosystems, USA), using the following program: initial denaturing at 94 °C for 3 min, followed by 30 or 35 cycles (for prokaryota or fungi) of denaturation at 94 °C for 15 s, PNA clamping at 75 °C for 10 s, primer annealing at 58 °C for 10 s (both primer pairs), extension at 72 °C for 60 s, followed by a final extension at 72 °C for 10 min and by cooldown to 4 °C.
The integrity and quality of the PCR products were checked on an agarose gel. PCR was repeated three times per sample, replicates were pooled [88] and sent for sequencing on an Illumina MiSeq platform (v3 chemistry) at the Génome Québec Innovation Center at the McGill University (Montréal, Canada).
The sequence datasets generated during and analyzed during the current study are available in the European Nucleotide Archive (ENA) repository (www.ebi.ac.uk/ena) under the project number PRJEB32050.

4.3. Bioinformatic Analysis of the Sequences

Illumina sequencing data were analyzed with QIIME 1.9 [89]. After joining paired ends with the “fastq-join” method [90], a quality filtering was applied (quality threshold: 25). Length boundaries of 200–1000 nucleotides were used to eliminate short sequences, such as primer dimers, as well as overly long sequences, such as wrongly merged reads. To extract fungal ITS reads, ITSx v.1.0.11 was used [91].
Chimeric sequences were removed using Vsearch [92]. Operational taxonomic units (OTUs) were generated at 97% sequence similarity by using the sumaclust method, which was shown to be more accurate than other clustering methods [93], and were identified, after alignment, using the uclust method and the databases SILVA, release 132 [94], for prokaryotes and UNITE v.7.2, release_s_01.12.2017 [95], for fungi. Unidentified and contaminant (plastidic and mitochondrial for Prokaryotes, Metazoa for Fungi) OTUs were removed, using the QIIME script “filter_taxa_from_otu_table.py”, as well as OTUs with less than 10 reads, to reduce noise. Samples with a low number of reads (threshold: 11,000 and 4000 reads for 16s rRNA gene and ITS2 dataset, respectively) were eliminated to optimize the per-sample coverage. Alpha- and beta-diversity metrics were calculated on rarefied datasets normalized to an even sequencing depth per sample: this was 11,950 reads for 16S rRNA gene dataset and 4850 reads for ITS2 dataset, when including all kept samples. When the analysis was performed on subsamples of the datasets, the normalization was always adapted to the sample with lowest number of sequences, in order to optimize robustness and reliability of the statistical analyses. For example, when analyzing only the Xf-infected Leaf samples, the rarefaction values were the 18,450 and 7180 reads per sample for the 16S and the ITS2 dataset, respectively.
Statistical comparison of alpha diversity between samples was performed with SPSS version 20 (IBM Corporation, USA), using factorial ANOVA and Duncan’s post hoc test at alpha-level = 0.05. Normality of distribution and heteroscedasticity were tested with the Shapiro–Wilk and the Levene’s tests, respectively. The factors considered were as follows: “Infection status” (2 levels, Xf-infected and -uninfected), “Cultivar” (2 levels, “Leccino” and “Cellina di Nardò”), “Habitat” (2 levels, branches and leaves), and their interactions. The “Type of microbiota” (total community, epiphytes + endophytes, or endophytes only) was also tested, however, only for its main effect, since the endophytes are a subpopulation of the total microbiota and their diversity is obviously lower. Beta-diversity (distance between samples’ microbiome structures) was computed separately on total community and endophytes, by using Bray–Curtis distances; the effects of the investigated factors were statistically assessed with the Adonis test [96]. The script “group_significance.py” was used to perform g-test of independence as implemented in QIIME. Beta-diversity plots (Principal Component Analysis, PCoA) were visualized by Emperor [97]. The full list of scripts used for each QIIME pipeline is available upon request. The software STAMP [98] was used to assess significantly different taxa between sample groups, using the nonparametric White’s test [99] for two-group comparisons (“Leccino” vs. “Cellina di Nardò”) and the Kruskal–Wallis test [100] for four-group comparisons (“Leccino” vs. “Cellina di Nardò” × Xf-infected vs. -uninfected) at alpha-level = 0.05. All p-significance values were corrected for multiple testing using the false discovery rate (FDR) adjustment according to Benjamini-Hochberg [101].
The software Explicet [102] was used to generate taxonomy bar plots, Bray–Curtis distances heat-maps and rarefaction curves. Extended error plots and the Box plots were directly exported from STAMP. Adobe Photoshop CS6 (Adobe Systems Inc., USA) was used to assemble and label the final figures.

4.4. Correlation of Co–Occurrence Patterns and Network Analysis

To identify significant patterns of correlated bacteria in the Xf-infected leaves of “Leccino” trees, the fungal and bacterial OTUs with at least 30 total reads and occurring in at least 3 samples were subjected to a co-occurrence analysis, using the software CoNet [103], which is available as add-on in Cytoscape 3.7 [104]. Non-rarefied, absolute abundance dataset was used, as recommended to avoid the false-positive issues when using relative abundance data [70]. A preliminary check of the dataset indicated a total of 1378 possible interactions. Therefore, we set a threshold of 650 top and bottom edges in the network (edge = correlation between two OTUs). Then, we computed a distribution of pairwise scores for each of the following similarity measures: Bray–Curtis distances, Kullback–Leibler dissimilarity, and Pearson and Spearman correlations. For each measure, 100 permutations were generated (with renormalization for correlation measures and row-shuffling) at 100 bootstrap-resampling scores. Unstable edges (with score outside the 2.5–97.5 percentiles of the bootstraps’ distribution) were removed. The four measure-specific p-values were then merged by using Brown’s method; variances were pooled by combining the p-values of permutations and bootstraps. After FDR-correction, using the Benjamini–Hochberg method, edges with a p-value below 0.05 were kept. Considering that the distance measures (Bray–Curtis and Kullback–Leibler) are sensitive to outliers and robust to compositionality, while correlation measures (Pearson and Spearman) are biased by compositionality and robust to outliers [103], only edges supported by at least three similarity measures were retained. The network layout was arranged using the “edge-forced spring embedded” algorithm [105], additionally weighted by p-values; this method draws unbiased networks with interconnected nodes close each other and single-linked ones placed apart [106]. “Hub” nodes, representing taxa with disproportionately large effect in shaping the microbial network [107], were identified with the software cytoHubba [108], based on degree (number of connections) and betweenness centrality values [69,107].
Legends of the network were created with the Cytoscape-App “Legend creator” (http://apps.cytoscape.org/apps/legendcreator). Adobe Photoshop CS6 (Adobe Systems Inc., USA) was used to assemble and label the final figures.

5. Conclusions

In this work, we performed a large-scale observational study of the olive tree microbiome in a X. fastidiosa-resistant and a X. fastidiosa-susceptible cultivar in the Salento region, an area where a severe X. fastidiosa outbreak has been taking place since 2013. Our results highlighted the stability of the endophytic bacterial microbiota in the leaves of Xf-infected “Leccino” cultivar (X. fastidiosa-resistant), in contrast with the strong dysbiosis observed in the X. fastidiosa-susceptible cultivar “Cellina di Nardò”.
The microbiota of “Leccino” trees are also more diverse and include cultivar-specific bacterial taxa that appear to interact, directly or indirectly, with X. fastidiosa.
The maintenance of a healthy microbiota and the presence of cultivar-specific microbes might support the resistance of “Leccino” to X. fastidiosa infection. Our results represent a first step toward the identification of microbial species or consortia with potential biotechnological applications for the biological treatment of the Olive Quick Decline Syndrome in Salento. Our data could be used to perform a targeted isolation of candidate microorganisms of interest to be tested against X. fastidiosa under experimental conditions.

Supplementary Materials

The following are available online at https://www.mdpi.com/2076-0817/9/1/35/s1. Table S1: Number of high-quality reads obtained by Illumina sequencing. Table S2: Number of replicates per sample type analyzed in this work. Table S3 (provided as excel file): Bacterial OTU tables. Table S4 (provided as excel file): Fungal OTU tables. Table S5: Meteorological data records of the last three years in the area in which Xylella fastidiosa-infected or Xylella fastidiosa-uninfected samples were collected. Table S6: Physico-chemical soil analysis of sampling areas in which Xylella fastidiosa-infected or Xylella fastidiosa-uninfected samples were collected compared to typical reference values. Table S7: Analysis of pathogen species in the trees selected for this work. Figure S1: Rarefaction curves. Figure S2: Relative abundance of Xylella in the analyzed samples. Figure S3: Per-sample beta-diversity metrics of bacteria. Figure S4: Per-group beta-diversity metrics of bacteria and fungi. Figure S5: Per-sample beta-diversity metrics of fungi. Figure S6: Original co-occurrence network. Figure S7: Distribution of the OTU identified as Planomicrobium among sample groups.

Author Contributions

Conceptualization, J.B.M., M.H., M.C., and A.L.; methodology, J.B.M., M.H., M.V., A.L., M.C.; software, M.C. and M.H.; validation, M.H., P.C. and A.L.; formal analysis, L.D.B., P.C. and A.L.; investigation, M.V., E.S. and M.C.; resources, L.D.B. and A.L.; data curation, M.C. and A.L.; writing—original draft preparation, M.C., M.V. and A.L.; writing—review and editing, M.H., E.S., L.D.B. and P.C. M.V., M.C. and A.L.; visualization, M.C.; supervision, M.C., L.D.B. and A.L.; project administration, L.D.B. and A.L. All authors have read and agreed to the published version of the manuscript.

Funding

This research received no external funding.

Acknowledgments

We thank Thomas Sieber (ETH, Zurich, Switzerland) for valuable discussions on endophytes, and Teodoro “Rino” Semeraro (University of Salento, Lecce, Italy) for the retrieval of meteorological records.

Conflicts of Interest

The authors declare that they have no competing interest.

References

  1. Zilber-Rosenberg, I.; Rosenberg, E. Role of microorganisms in the evolution of animals and plants. The hologenome theory of evolution. FEMS Microbiol. Rev. 2008, 32, 723–735. [Google Scholar] [CrossRef] [PubMed]
  2. Vandenkoornhuyse, P.; Quaiser, A.; Duhamel, M.; Le Van, A.; Dufresne, A. The importance of the microbiome of the plant holobiont. New Phytol. 2015, 206, 1196–1206. [Google Scholar] [CrossRef] [PubMed]
  3. Gopal, M.; Gupta, A. Microbiome selection could spur next-generation plant breeding strategies. Front. Microbiol. 2016, 7, 1971. [Google Scholar] [CrossRef] [PubMed] [Green Version]
  4. Winston, M.E.; Hampton-Marcell, J.; Zarraonaindia, I.; Owens, S.M.; Moreau, C.S.; Gilbert, J.A.; Hartsel, J.; Kennedy, S.J.; Gibbons, S.M. Understanding cultivar-specificity and soil determinants of the cannabis microbiome. PLoS ONE 2014, 9, e99641. [Google Scholar] [CrossRef] [PubMed]
  5. Bulgarelli, D.; Schlaeppi, K.; Spaepen, S.; van Loren Themaat, E.V.; Schulze-Lefert, P. Structure and functions of the bacterial microbiota of plants. Annu. Rev. Plant Biol. 2013, 64, 807–838. [Google Scholar] [CrossRef] [PubMed] [Green Version]
  6. Lugtenberg, B.; Kamilova, F. Plant-growth-promoting rhizobacteria. Annu. Rev. Microbiol. 2009, 63, 541–556. [Google Scholar] [CrossRef] [Green Version]
  7. Yang, J.; Kloepper, J.W.; Ryu, C.M. Rhizosphere bacteria help plants tolerate abiotic stress. Trends Plant Sci. 2009, 14, 1–4. [Google Scholar] [CrossRef]
  8. Partida-Martínez, L.P.; Heil, M. The microbe-free plant: Fact or artifact? Front. Plant Sci. 2011, 2, 100. [Google Scholar] [CrossRef] [Green Version]
  9. Müller, H.; Berg, C.; Landa, B.B.; Auerbach, A.; Moissl-Eichinger, C.; Berg, G. Plant genotype-specific archaeal and bacterial endophytes but similar Bacillus antagonists colonize Mediterranean olive trees. Front. Microbiol. 2015, 6, 138. [Google Scholar] [CrossRef] [Green Version]
  10. Abdelfattah, A.; Li Destri Nicosia, M.G.; Cacciola, S.O.; Droby, S.; Schena, L. Metabarcoding analysis of fungal diversity in the phyllosphere and carposphere of olive (Olea europaea). PLoS ONE 2015, 10, e0131069. [Google Scholar] [CrossRef] [Green Version]
  11. Preto, G.; Martins, F.; Pereira, J.A.; Baptista, P. Fungal community in olive fruits of cultivars with different susceptibilities to anthracnose and selection of isolates to be used as biocontrol agents. Biol. Control 2017, 110, 1–9. [Google Scholar] [CrossRef] [Green Version]
  12. Soussi, A.; Ferjani, R.; Marasco, R.; Guesmi, A.; Cherif, H.; Rolli, E.; Mapelli, F.J.; Ouzari, H.I.; Daffonchio, D.; Cherif, A. Plant-associated microbiomes in arid lands. Diversity, ecology and biotechnological potential. Plant Soil 2016, 405, 357–370. [Google Scholar] [CrossRef] [Green Version]
  13. Gómez-Lama Cabanás, C.; Legarda, G.; Ruano-Rosa, D.; Pizarro-Tobías, P.; Valverde-Corredor, A.; Niqui, J.L.; Triviño, J.C.; Roca, A.; Mercado-Blanco, J. Indigenous Pseudomonas spp. Strains from the Olive (Olea europaea L.) rhizosphere as effective biocontrol agents against Verticillium dahliae: From the host roots to the bacterial genomes. Front. Microbiol. 2018, 9, 277. [Google Scholar] [CrossRef] [Green Version]
  14. Passos da Silva, D.; Castañeda-Ojeda, M.P.; Moretti, C.; Buonaurio, R.; Ramos, C.; Venturi, V. Bacterial multispecies studies and microbiome analysis of a plant disease. Microbiology 2014, 160, 556–566. [Google Scholar] [CrossRef] [PubMed]
  15. Saponari, M.; Boscia, D.; Altamura, G.; Loconsole, G.; Zicca, S.; D’Attoma, G.; Morelli, M.; Palmisano, F.; Saponari, A.; Tavano, D.; et al. Isolation and pathogenicity of Xylella fastidiosa associated to the olive quick decline syndrome in southern Italy. Sci. Rep. 2017, 7, 17723. [Google Scholar] [CrossRef] [PubMed]
  16. Maggiore, G.; Semeraro, T.; Aretano, R.; De Bellis, L.; Luvisi, A. GIS analysis of land-use change in threatened landscapes by Xylella fastidiosa. Sustainability 2019, 11, 253. [Google Scholar] [CrossRef] [Green Version]
  17. Saponari, M.; Loconsole, G.; Cornara, D.; Yokomi, R.K.; De Stradis, A.; Boscia, D.; Bosco, D.; Martelli, G.P.; Krugner, R.; Porcelli, F. Infectivity and transmission of Xylella fastidiosa by Philaenus spumarius (Hemiptera: Aphrophoridae) in Apulia, Italy. J. Econ. Entomol. 2014, 107, 1316–1319. [Google Scholar] [CrossRef] [Green Version]
  18. Strona, G.; Carstens, C.J.; Beck, P.S.A. Network analysis reveals why Xylella fastidiosa will persist in Europe. Sci. Rep. 2017, 7, 71. [Google Scholar] [CrossRef]
  19. EFSA. Update of a database of host plants of Xylella fastidiosa: 20 November 2015. EFS2 J. 2016, 14. [Google Scholar] [CrossRef]
  20. Carlucci, A.; Lops, F.; Marchi, G.; Mugnai, L.; Surico, G. Has Xylella fastidiosa "chosen" olive trees to establish in the Mediterranean basin? Phytopathol. Mediterr. 2013, 52, 541–544. [Google Scholar]
  21. Luvisi, A.; Ampatzidis, Y.; De Bellis, L. Plant pathology and information technology: Opportunity for management of disease outbreak and applications in regulation frameworks. Sustainability 2016, 8, 831. [Google Scholar] [CrossRef] [Green Version]
  22. Bucci, E.M. Xylella fastidiosa, a new plant pathogen that threatens global farming: Ecology, molecular biology, search for remedies. Biochem. Biophys. Res. Commun. 2018, 502, 173–182. [Google Scholar] [CrossRef] [PubMed]
  23. McElrone, A.J.; Jackson, S.; Habdas, P. Hydraulic disruption and passive migration by a bacterial pathogen in oak tree xylem. J. Exp. Bot. 2018, 59, 2649–2657. [Google Scholar] [CrossRef] [PubMed] [Green Version]
  24. Sun, Q.; Sun, Y.; Walker, M.A.; Labavitch, J.M. Vascular occlusions in grapevines with Pierce’s disease make disease symptom development worse. Plant Physiol. 2013, 161, 1529–1541. [Google Scholar] [CrossRef] [PubMed] [Green Version]
  25. Cardinale, M.; Luvisi, A.; Meyer, J.B.; Sabella, E.; De Bellis, L.; Cruz, A.C.; Ampatzidis, Y.; Cherubini, P. Specific Fluorescence in Situ Hybridization (FISH) test to highlight colonization of Xylem vessels by Xylella fastidiosa in naturally infected olive trees (Olea europaea L.). Front. Plant Sci. 2018, 9, 431. [Google Scholar] [CrossRef] [PubMed] [Green Version]
  26. De Benedictis, M.; De Caroli, M.; Baccelli, I.; Marchi, G.; Bleve, G.; Gallo, A.; Ranaldi, F.; Falco, V.; Pasquali, V.; Piro, G.; et al. Vessel occlusion in three cultivars of Olea europaea naturally exposed to Xylella fastidiosa in open field. J. Phytopathol. 2017, 165, 589–594. [Google Scholar] [CrossRef]
  27. Giampetruzzi, A.; Morelli, M.; Saponari, M.; Loconsole, G.; Chiumenti, M.; Boscia, D.; Savino, V.N.; Martelli, G.P.; Saldarelli, P. Transcriptome profiling of two olive cultivars in response to infection by the CoDiRO strain of Xylella fastidiosa subsp. pauca. BMC Genom. 2016, 1, 475. [Google Scholar] [CrossRef] [Green Version]
  28. Martelli, G.P. The current status of the quick decline syndrome of olive in southern Italy. Phytoparasitica 2016, 44, 1–10. [Google Scholar] [CrossRef]
  29. Luvisi, A.; Aprile, A.; Sabella, E.; Vergine, M.; Nicolì, F.; Nutricati, E.; Miceli, A.; Negro, C.; De Bellis, L. Xylella fastidiosa subsp. pauca (CoDiRO strain) infection in four olive (Olea europaea L.) cultivars: Profile of phenolic compounds in leaves and progression of leaf scorch symptoms. Phytopathol. Mediterr. 2017, 56, 259–273. [Google Scholar]
  30. Sabella, E.; Luvisi, A.; Aprile, A.; Negro, C.; Vergine, M.; Nicolì, F.; Miceli, A.; De Bellis, L. Xylella fastidiosa induces differential expression of lignification related-genes and lignin accumulation in tolerant olive trees cv. Leccino. J. Plant Physiol. 2018, 220, 60–68. [Google Scholar] [CrossRef]
  31. Deyett, E.; Roper, M.C.; Ruegger, P.; Yang, J.I.; Borneman, J.; Rolshausen, P.E. Microbial landscape of the grapevine endosphere in the context of pierce’s disease. Phytobiomes 2017, 1, 138–149. [Google Scholar] [CrossRef]
  32. Azevedo, J.L.; Araújo, W.L.; Lacava, P.T. The diversity of citrus endophytic bacteria and their interactions with Xylella fastidiosa and host plants. Gen. Mol. Biol. 2016, 39, 476–491. [Google Scholar] [CrossRef] [PubMed] [Green Version]
  33. Baptista, P.; Cameirão, C.; Giampetruzzi, A.; Morelli, M.; Kubaa, R.A.; Altamura, G.; D’Attoma, G.; Pereira, J.A.; Neto, T.L.; Saldarelli, P. Understanding the olive microbiome of susceptible and resistant cultivars for sustainable biocontrol. J. Plant Pathol. 2019, 101, 849. [Google Scholar] [CrossRef]
  34. Berg, G.; Köberl, M.; Rybakova, D.; Müller, H.; Grosch, R.; Smalla, K. Plant microbial diversity is suggested as the key to future biocontrol and health trends. FEMS Microbiol. Ecol. 2017, 93. [Google Scholar] [CrossRef]
  35. Chaparro, J.M.; Sheflin, A.M.; Manter, D.K.; Vivanco, J.M. Manipulating the soil microbiome to increase soil health and plant fertility. Biol. Fertil. Soils 2012, 48, 489–499. [Google Scholar] [CrossRef]
  36. Ramírez-Puebla, S.T. Servín-Garcidueñas, L.E.; Jiménez-Marín, B.; Bolaños, L.M.; Rosenblueth, M.; Martínez, J.; Rogel, M.A.; Ormeño-Orrillo, E.; Martínez-Romero, E. Gut and root microbiota commonalities. Appl. Environ. Microbiol. 2013, 79, 2–9. [Google Scholar] [CrossRef] [Green Version]
  37. Barberán, A.; Bates, S.T.; Casamayor, E.O.; Fierer, N. Using network analysis to explore co-occurrence patterns in soil microbial communities. ISME J. 2012, 6, 343–351. [Google Scholar] [CrossRef] [Green Version]
  38. Saponari, M.; Boscia, D.; Nigro, F.; Martelli, G.P. Identification of DNA sequences related to Xylella fastidiosa in oleander, almond and olive trees exhibiting leaf scorch symptoms in Apulia (southern Italy). J. Plant Pathol. 2013, 95, 668. [Google Scholar]
  39. Bragard, C.; Dehnen-Schmutz, K.; Di Serio, F.; Gonthier, P.; Jacques, M.A.; Miret, J.A.J.; Fejer Justesen, A.; MacLeod, A.; Magnusson, C.S.; Milonas, P.; et al. Effectiveness of in planta control measures for Xylella fastidiosa. EFS2 J. 2019, 17, 459. [Google Scholar] [CrossRef]
  40. Morelli, M.; D’Attoma, G.; Saponari, M.; Saldarelli, P. Evaluation of an endophytic symbiont as a putative biocontrol agent of the codiro strain of Xylella fastidiosa. J. Plant Pathol. 2019, 99, S54. [Google Scholar] [CrossRef]
  41. Cruz, A.C.; Luvisi, A.; De Bellis, L.; Ampatzidis, Y. X-FIDO: An effective application for detecting olive quick decline syndrome with deep learning and data fusion. Front. Plant Sci. 2017, 8, 1741. [Google Scholar] [CrossRef]
  42. Chiriacò, M.S.; Luvisi, A.; Primiceri, E.; Sabella, E.; De Bellis, L.; Maruccio, G. Development of a lab-on-a-chip method for rapid assay of Xylella fastidiosa subsp. pauca strain CoDiRO. Sci. Rep. 2018, 8, 7376. [Google Scholar] [CrossRef]
  43. Redford, A.J.; Bowers, R.M.; Knight, R.; Linhart, Y.; Fierer, N. The ecology of the phyllosphere: Geographic and phylogenetic variability in the distribution of bacteria on tree leaves. Environ. Microbiol. 2010, 12, 2885–2893. [Google Scholar] [CrossRef] [PubMed] [Green Version]
  44. Frey, B.; Rime, T.; Phillips, M.; Stierli, B.; Hajdas, I.; Widmer, F.; Hartmann, M. Microbial diversity in European alpine permafrost and active layers. FEMS Microbiol. Ecol. 2016, 92, fiw018. [Google Scholar] [CrossRef] [PubMed] [Green Version]
  45. Zaitsev, G.M.; Tsitko, I.V.; Rainey, F.A.; Trotsenko, Y.A.; Uotila, J.S.; Stackebrandt, E.; Salkinoja-Salonen, M.S. New aerobic ammonium-dependent obligately oxalotrophic bacteria: Description of Ammoniphilus oxalaticus gen. nov., sp. nov. and Ammoniphilus oxalivorans gen. nov., sp. nov. Int. J. Syst. Bacteriol. 1998, 48 Pt 1, 151–163. [Google Scholar] [CrossRef]
  46. Carding, S.; Verbeke, K.; Vipond, D.T.; Corfe, B.M.; Owen, L.J. Dysbiosis of the gut microbiota in disease. Microb. Ecol. Health Dis. 2015, 26, 26191. [Google Scholar] [CrossRef]
  47. Gough, E.; Shaikh, H.; Manges, A.R. Systematic review of intestinal microbiota transplantation (fecal bacteriotherapy) for recurrent Clostridium difficile infection. Clin. Infect. Dis. 2011, 53, 994–1002. [Google Scholar] [CrossRef] [Green Version]
  48. Hassani, M.A.; Durán, P.; Hacquard, S. Microbial interactions within the plant holobiont. Microbiome 2018, 6, 58. [Google Scholar] [CrossRef]
  49. Sánchez-Cañizares, C.; Jorrín, B.; Poole, P.S.; Tkacz, A. Understanding the holobiont: The interdependence of plants and their microbiome. Curr. Opin. Microbiol. 2017, 38, 188–196. [Google Scholar] [CrossRef]
  50. Kwak, M.-J.; Kong, H.G.; Choi, K.; Kwon, S.K.; Song, J.Y.; Lee, J.; Lee, P.A.; Choi, S.Y.; Seo, M.; Lee, H.J.; et al. Rhizosphere microbiome structure alters to enable wilt resistance in tomato. Nat. Biotechnol. 2018, 36, 1100. [Google Scholar] [CrossRef]
  51. Doty, S.L. (Ed.) Functional Importance of the Plant Microbiome; Springer: Cham, Switzerland, 2017; pp. 1–5. [Google Scholar]
  52. Delgado-Baquerizo, M.; Maestre, F.T.; Reich, P.B.; Jeffries, T.C.; Gaitan, J.J.; Encinar, D.; Berdugo, M.; Campbell, C.D.; Singh, B.K. Microbial diversity drives multifunctionality in terrestrial ecosystems. Nat. Commun. 2016, 7, 10541. [Google Scholar] [CrossRef] [PubMed] [Green Version]
  53. van Elsas, J.D.; Chiurazzi, M.; Mallon, C.A.; Elhottovā, D.; Krištůfek, V.; Falcão Salles, J. Microbial diversity determines the invasion of soil by a bacterial pathogen. Proc. Natl. Acad. Sci. USA 2012, 109, 1159–1164. [Google Scholar] [CrossRef] [PubMed] [Green Version]
  54. Wehner, J.; Antunes, P.M.; Powell, J.R.; Mazukatow, J.; Rillig, M.C. Plant pathogen protection by arbuscular mycorrhizas: A role for fungal diversity? Pedobiologia 2010, 53, 197–201. [Google Scholar] [CrossRef]
  55. van der Heijden, M.G.A.; Wagg, C. Soil microbial diversity and agro-ecosystem functioning. Plant Soil 2013, 363, 1–5. [Google Scholar] [CrossRef] [Green Version]
  56. Denison, R.F.; Toby Kiers, E. Why are most rhizobia beneficial to their plant hosts, rather than parasitic? Microbes Infect. 2004, 6, 1235–1239. [Google Scholar] [CrossRef] [PubMed]
  57. Trivedi, P.; Spann, T.; Wang, N. Isolation and characterization of beneficial bacteria associated with citrus roots in Florida. Microb. Ecol. 2011, 62, 324–336. [Google Scholar] [CrossRef]
  58. Khan, A.L.; Waqas, M.; Kang, S.M.; Al-Harrasi, A.; Hussain, J.; Al-Rawahi, A.; Al-Khiziri, S.; Ullah, I.; Ali, L.; Jung, H.Y.; et al. Bacterial endophyte Sphingomonas sp. LK11 produces gibberellins and IAA and promotes tomato plant growth. J. Microbiol. 2014, 52, 689–695. [Google Scholar] [CrossRef]
  59. Naveed, M.; Joubert, P.M.; Doty, S.L. The endophyte Enterobacter sp. FD17: A maize growth enhancer selected based on rigorous testing of plant beneficial traits and colonization characteristics. Biol. Fertil. Soil 2014, 50, 249–262. [Google Scholar] [CrossRef]
  60. Ofek, M.; Hadar, Y.; Minz, D. Ecology of root colonizing Massilia (Oxalobacteraceae). PLoS ONE 2012, 7, e40117. [Google Scholar] [CrossRef]
  61. Cardinale, M.; Suarez, C.; Steffens, D.; Ratering, S.; Schnell, S. Effect of different soil phosphate sources on the active bacterial microbiota is greater in the rhizosphere than in the endorhiza of barley (Hordeum vulgare L.). Microb. Ecol. 2018, 77, 689–700. [Google Scholar] [CrossRef]
  62. Mercado-Blanco, J.; Bakker, P.A.H.M. Interactions between plants and beneficial Pseudomonas spp.: Exploiting bacterial traits for crop protection. Antonie Van Leeuwenhoek 2007, 92, 367–389. [Google Scholar] [CrossRef]
  63. Schlaeppi, K.; Bulgarelli, D. The plant microbiome at work. Mol. Plant Microbe Interact. 2015, 28, 212–217. [Google Scholar] [CrossRef] [PubMed] [Green Version]
  64. Deines, P.; Bosch, T.C.G. Transitioning from microbiome composition to microbial community interactions: The potential of the metaorganism hydra as an experimental model. Front. Microbiol. 2016, 7, 1610. [Google Scholar] [CrossRef] [PubMed] [Green Version]
  65. Stewart, E.J. Growing unculturable bacteria. J. Bacteriol. 2012, 194, 4151–4160. [Google Scholar] [CrossRef] [Green Version]
  66. Vartoukian, S.R.; Palmer, R.M.; Wade, W.G. Strategies for culture of ’unculturable’ bacteria. FEMS Microbiol. Lett. 2010, 309, 1–7. [Google Scholar] [CrossRef] [PubMed] [Green Version]
  67. Cardinale, M.; Grube, M.; Erlacher, A.; Quehenberger, J.; Berg, G. Bacterial networks and co-occurrence relationships in the lettuce root microbiota. Environ. Microbiol. 2015, 17, 239–252. [Google Scholar] [CrossRef]
  68. Edwards, J.; Johnson, C.; Santos-Medellín, C.; Lurie, E.; Podishetty, N.K.; Bhatnagar, S.; Eisen, J.A.; Sundaresan, V. Structure, variation, and assembly of the root-associated microbiomes of rice. Proc. Natl. Acad. Sci. USA 2015, 112, E911–E920. [Google Scholar] [CrossRef] [Green Version]
  69. Shi, S.; Nuccio, E.E.; Shi, Z.J.; He, Z.; Zhou, J.; Firestone, M.K. The interconnected rhizosphere. High network complexity dominates rhizosphere assemblages. Ecol. Lett. 2016, 19, 926–936. [Google Scholar] [CrossRef] [Green Version]
  70. Ambika Manirajan, B.; Maisinger, C.; Ratering, S.; Rusch, V.; Schwiertz, A.; Cardinale, M.; Schnell, S. Diversity, specificity, co-occurrence and hub taxa of the bacterial–fungal pollen microbiome. FEMS Microbiol. Ecol. 2018, 94, fiy112. [Google Scholar] [CrossRef] [Green Version]
  71. Berry, D.; Widder, S. Deciphering microbial interactions and detecting keystone species with co-occurrence networks. Front. Microbiol. 2014, 5, 219. [Google Scholar] [CrossRef] [Green Version]
  72. Nicolì, F.; Negro, C.; Nutricati, E.; Vergine, M.; Aprile, A.; Sabella, E.; Damiano, G.; De Bellis, L.; Luvisi, A. Accumulation of azelaic acid in Xylella fastidiosa-infected olive trees: A mobile metabolite for health screening. Phytopathology 2018, 109, 318–325. [Google Scholar] [CrossRef] [PubMed] [Green Version]
  73. Ministero dei beni e delle attività culturali e del turismo; Direzione regionale per i beni culturali e paesaggistici della Puglia; Regione Puglia. Integrazione alle dichiarazioni di notevole interesse pubblico della fascia costiera salentina, ricadente nei comuni di Lecce, Vernole, Melendugno e Otranto. Available online: http://paesaggio.regione.puglia.it/PPTR_2015/6_%20Il%20sistema%20delle%20tutele/6.4_Schede%20di%20identificazione%20e%20discipline%20d’uso/PAE0134_scheda.pdf (accessed on 16 December 2019).
  74. Harper, S.J.; Ward, L.I.; Clover, G.R.G. Development of LAMP and real-time PCR methods for the rapid detection of Xylella fastidiosa for quarantine and field applications. Phytopathology 2010, 100, 1282–1288. [Google Scholar] [CrossRef] [PubMed]
  75. Romanazzi, G.; Murolo, S.; Pizzichini, L.; Nardi, S. Esca in young and mature vineyards, and molecular diagnosis of the associated fungi. Eur. J. Plant Pathol. 2009, 125, 277–290. [Google Scholar] [CrossRef]
  76. Garrido, C.; Carbú, M.F.; Fernández-Acero, J.; Boonham, N.; Colyer, A.J.; Cantoral, M.; Budge, G. Development of protocols for detection of Colletotrichum acutatum and monitoring of strawberry anthracnose using real-time PCR. Plant Pathol. 2009, 58, 43–51. [Google Scholar] [CrossRef]
  77. Martín, M.T.; Cuesta, M.J.; Martín, L. Development of SCAR primers for PCR assay to detect Diplodia seriata. Int. Sch. Res. Not. 2014, 2014, 9. [Google Scholar] [CrossRef] [Green Version]
  78. Martín, M.T.; Cobos, R.; Martín, L.; López-Enríquez, L. Real-time PCR detection of Phaeomoniella chlamydospora and Phaeoacremonium aleophilum. Appl. Environ. Microbiol. 2012, 78, 3985–3991. [Google Scholar] [CrossRef] [Green Version]
  79. Aroca, A.; Raposo, R.; Lunello, P. A biomarker for the identification of four Phaeoacremonium species using the beta-tubulin gene as the target sequence. Appl. Microbiol. Biotechnol. 2008, 80, 1131–1140. [Google Scholar] [CrossRef]
  80. Carlucci, A.; Lops, F.; Cibelli, F.; Raimondo, M.L. Phaeoacremonium species associated with olive wilt and decline in southern Italy. Eur. J. Plant Pathol. 2015, 141, 717–729. [Google Scholar] [CrossRef] [Green Version]
  81. Drenth, A.; Wagels, G.; Smith, B.; Sendall, B.; O’Dwyer, C.; Irvine, G.; Irwin, J.A.G. Development of a DNA-based method for detection and identification of Phytophthora species. Australas. Plant Path. 2006, 35, 147–159. [Google Scholar] [CrossRef]
  82. Bilodeau, G.J.; Koike, S.T.; Uribe, P.; Martin, F.N. Development of an assay for rapid detection and quantification of Verticillium dahliae in soil. Phytopathology 2012, 102, 331–343. [Google Scholar] [CrossRef] [Green Version]
  83. Edwards, K.; Johnstone, C.; Thompson, C. A simple and rapid method for the preparation of plant genomic DNA for PCR analysis. Nucleic Acids Res. 1991, 19, 1349. [Google Scholar] [CrossRef] [PubMed]
  84. D’Attoma, G.; Morelli, M.; Saldarelli, P.; Saponari, M.; Giampetruzzi, A.; Boscia, D.; Savino, V.N.; De La Fuente, L.; Cobine, P.A. Ionomic differences between susceptible and resistant olive cultivars infected by Xylella fastidiosa in the outbreak area of salento, italy. Pathogens 2019, 8, 272. [Google Scholar] [CrossRef] [PubMed] [Green Version]
  85. Taylor, D.L.; Walters, W.A.; Lennon, N.J.; Bochicchio, J.; Krohn, A.; Caporaso, J.G.; Pennanen, T. Accurate estimation of fungal diversity and abundance through improved lineage-specific primers optimized for illumina amplicon sequencing. Appl. Environ. Microbiol. 2016, 82, 7217–7226. [Google Scholar] [CrossRef] [PubMed] [Green Version]
  86. Lundberg, D.S.; Yourstone, S.; Mieczkowski, P.; Jones, C.D.; Dangl, J.L. Practical innovations for high-throughput amplicon sequencing. Nat. Methods 2013, 10, 999–1002. [Google Scholar] [CrossRef] [PubMed]
  87. Cregger, M.A.; Veach, A.M.; Yang, Z.K.; Crouch, M.J.; Vilgalys, R.; Tuskan, G.A.; Schadt, C.W. The Populus holobiont: Dissecting the effects of plant niches and genotype on the microbiome. Microbiome 2018, 6, 31. [Google Scholar] [CrossRef]
  88. Mayerhofer, J.; Eckard, S.; Hartmann, M.; Grabenweger, G.; Widmer, F.; Leuchtmann, A.; Enkerli, J. Assessing effects of the entomopathogenic fungus Metarhizium brunneum on soil microbial communities in Agriotes spp. biological pest control. FEMS Microbiol. Ecol. 2017, 93, fix117. [Google Scholar] [CrossRef]
  89. Caporaso, J.G.; Kuczynski, J.; Stombaugh, J.; Bittinger, K.; Bushman, F.D.; Costello, E.K.; Fierer, N.; Peña, A.G.; Goodrich, J.K.; Gordon, J.I.; et al. QIIME allows analysis of high-throughput community sequencing data. Nat. Methods 2010, 7, 335–336. [Google Scholar] [CrossRef] [Green Version]
  90. Aronesty, E. Comparison of sequencing utility programs. Open Bioinform. J. 2013, 7, 1–8. [Google Scholar] [CrossRef]
  91. Bengtsson-Palme, J.; Ryberg, M.; Hartmann, M.; Branco, S.; Wang, Z.; Godhe, A.; De Wit, P.; Sanchez-Garcia, M.; Ebersberger, I.; de Sousa, F.; et al. Improved software detection and extraction of ITS1 and ITS2 from ribosomal ITS sequences of fungi and other eukaryotes for analysis of environmental sequencing data. Methods Ecol. Evol. 2013, 4, 914–919. [Google Scholar] [CrossRef]
  92. Rognes, T.; Flouri, T.; Nichols, B.; Quince, C.; Mahé, F. VSEARCH. A versatile open source tool for metagenomics. PeerJ 2016, 4, e2584. [Google Scholar] [CrossRef]
  93. Jackson, M.A.; Bell, J.T.; Spector, T.D.; Steves, C.J. A heritability-based comparison of methods used to cluster 16S rRNA gene sequences into operational taxonomic units. PeerJ 2016, 4, e2341. [Google Scholar] [CrossRef] [PubMed] [Green Version]
  94. Quast, C.; Pruesse, E.; Yilmaz, P.; Gerken, J.; Schweer, T.; Yarza, P.; Peplies, J.; Glöckner, F.O. The SILVA ribosomal RNA gene database project. Improved data processing and web-based tools. Nucleic Acids Res. 2013, 41, D590–D596. [Google Scholar] [CrossRef] [PubMed]
  95. Abarenkov, K.; Henrik Nilsson, R.; Larsson, K.H.; Alexander, I.J.; Eberhardt, U.; Erland, S.; Høiland, K.; Kjøller, R.; Larsson, E.; Pennanen, T.; et al. The UNITE database for molecular identification of fungi-recent updates and future perspectives. New Phytol. 2010, 186, 281–285. [Google Scholar] [CrossRef] [PubMed]
  96. McArdle, B.H.; Anderson, M.J. Fitting multivariate models to community data. A comment on distance-based redundancy analysis. Ecology 2001, 82, 290–297. [Google Scholar] [CrossRef]
  97. Vázquez-Baeza, Y.; Pirrung, M.; Gonzalez, A.; Knight, R. EMPeror. A tool for visualizing high-throughput microbial community data. GigaScience 2013, 2, 16. [Google Scholar] [CrossRef] [Green Version]
  98. Parks, D.; Beiko, R. Encyclopedia of Metagenomics; Nelson, K.E., Ed.; Springer Science + Business Media: New York, NY, USA, 2013; pp. 1–6. [Google Scholar]
  99. White, H. A heteroskedasticity-consistent covariance matrix estimator and a direct test for heteroskedasticity. Econometrica 1980, 48, 817–838. [Google Scholar] [CrossRef]
  100. Kruskal, W.H.; Wallis, W.A. Use of ranks in one-criterion variance analysis. J. Am. Stat. Assoc. 1952, 47, 583–621. [Google Scholar] [CrossRef]
  101. Benjamini, Y.; Hochberg, Y. Controlling the false discovery rate: A practical and powerful approach to multiple testing. J. R. Stat. Soc. Ser. B 1995, 57, 289–300. [Google Scholar] [CrossRef]
  102. Robertson, C.E.; Harris, J.K.; Wagner, B.D.; Granger, D.; Browne, K.; Tatem, B.; Feazel, L.M.; Park, K.; Pace, N.R.; Frank, D.N. Explicet: Graphical user interface software for metadata-driven management, analysis and visualization of microbiome data. Bioinformatics 2013, 29, 3100–3101. [Google Scholar] [CrossRef] [Green Version]
  103. Faust, K.; Raes, J. CoNet app: Inference of biological association networks using Cytoscape. F1000Research 2016, 5, 1519. [Google Scholar] [CrossRef]
  104. Shannon, P.; Markiel, A.; Ozier, O.; Baliga, N.S.; Wang, J.T.; Ramage, D.; Amin, N.; Schwikowski, B.; Ideker, T. Cytoscape. A software environment for integrated models of biomolecular interaction networks. Genome Res. 2003, 13, 2498–2504. [Google Scholar] [CrossRef] [PubMed]
  105. Kamada, T.; Kawai, S. An algorithm for drawing general undirected graphs. Inf. Process. Lett. 1989, 31, 7–15. [Google Scholar] [CrossRef]
  106. Kohl, M.; Wiese, S.; Warscheid, B. Cytoscape. Software for visualization and analysis of biological networks. Methods Mol. Biol. 2011, 696, 291–303. [Google Scholar] [CrossRef] [PubMed]
  107. Agler, M.T.; Ruhe, J.; Constanze Morhenn, S.K.; Kim, S.T.; Weigel, D.; Keme, E.M. Microbial hub taxa link host and abiotic factors to plant microbiome variation. PLoS Biol. 2016, 14, e1002352. [Google Scholar] [CrossRef] [Green Version]
  108. Chin, C.-H.; Chen, S.H.; Wu, H.H.; Ho, C.W.; Ko, M.T.; Lin, C.Y. cytoHubba: Identifying hub objects and sub-networks from complex interactome. BMC Syst. Biol. 2014, 8 (Suppl. S4), S11. [Google Scholar] [CrossRef] [Green Version]
Figure 1. Taxonomy map of the olive microbiome. The graph shows the 30 most abundant bacterial (A) and fungal (B) OTUs, named according to the best achieved identification. Samples are grouped according to the olive cultivar and then to the sample type.
Pathogens 09 00035 g001
Figure 2. Alpha-diversity metrics. Shannon–Wiener and Equitability indices for bacterial (A) and fungal (B) microbiota in olive, grouped per sample type and ordered by cultivar. Different letters indicate significantly different means (factorial ANOVA followed by Duncan’s post hoc test, p < 0.05).
Pathogens 09 00035 g002
Figure 3. Beta-diversity analysis of the microbiota associated to the olive cultivars “Leccino” and “Cellina di Nardò”. Principal Component Analysis (PCoA) plots of the Bray–Curtis distances between bacterial epiphytic + endophytic microbiota (A), bacterial endophytic microbiota (B), bacterial endophytic microbiota, with plot scaled according to the % of variance explained by the axes (C), fungal epiphytic + endophytic microbiota (D), and fungal endophytic microbiota (E). Xf = Xylella fastidiosa.
Pathogens 09 00035 g003
Figure 4. Extended error plots showing phyla (A) and genera (B) of bacterial endophytes significantly different between Xf-infected “Cellina di Nardò” and “Leccino” olive cultivars, according to White’s nonparametric test. FDR-corrected p-values (q-values) are shown. Taxa are ordered according to the effect size of the difference. Xf = Xylella fastidiosa.
Pathogens 09 00035 g004
Figure 5. Bacterial families (A) and genera (BM) significantly different between Xf-infected and -uninfected, “Cellina di Nardò” and “Leccino” olive cultivars (endophytes only), according to Kruskal–Wallis test at FDR-corrected p < 0.05. Xf = Xylella fastidiosa. CH = Xf-uninfected “Cellina di Nardò”; LH = Xf-uninfected “Leccino”; CI = Xf-infected “Cellina di Nardò”; LI = Xf-infected “Leccino”; “+” signs indicate outliers.
Pathogens 09 00035 g005
Figure 6. Co-occurrence network of the endophytic microbiota of “Leccino” leaves infected with Xylella fastidiosa. Node shape represents kingdom (circle = bacterial OTUs, squares = fungal OTUs), while size represents the degree (number of connections) according to the legend. Nodes were colored by phylum and labeled according to the lowest identified taxonomic level. Edges (connections) are colored green (positive) or red (negative), and they represent highly significant correlations according to four similarity measures (see Section 4 for details). Asterisks indicate taxa significantly enriched in “Leccino” (see Figure 5B–J). Arrow indicates the hub OTU Planomicrobium. The network layout was generated with the edge-forced spring-embedded algorithm, except for the X. fastidiosa cluster (Xylella OTU + first degree nodes) that was drawn separately with a circular layout for easy of interpretation (the original network is provided in Figure S6).
Pathogens 09 00035 g006
Table 1. Adonis tests based on the Bray–Curtis distances between samples of the olive-associated bacterial and fungal microbiota. The test was performed separately for total microbiota (epiphytes + endophytes) and for endophytes only. Significant values (p < 0.05) are indicated in bold. Xf = Xylella fastidiosa.
p Values
BacteriaFungi
FactorSubjectEpiphytes + EndophytesEndo-phytesEpiphytes + EndophytesEndo-Phytes
Infection statusAll samples0.0010.0010.0240.786
Infection status“Cellina di Nardò”0.0010.0010.0690.446
Infection status“Leccino”0.0670.0690.0010.184
Infection status“Cellina di Nardò” Branches0.0010.0280.0010.369
Infection status“Leccino” Branches0.0070.0120.0010.0014
Infection status“Cellina di Nardò” Leaves0.0010.0010.0010.902
Infection status“Leccino” Leaves0.0350.4290.0060.114
CultivarAll samples0.0020.0010.0040.081
CultivarXf-infected0.0010.0010.0280.05
CultivarXf-uninfected0.0010.0400.0010.276
CultivarXf-infected Branches0.0010.0090.0010.055
CultivarXf-infected Leaves0.0010.0130.0010.122
CultivarXf-uninfected Branches0.0110.2430.0010.0014
CultivarXf-uninfected Leaves0.0010.1010.0010.32
HabitatAll samples0.0140.4830.0010.205
Habitat“Cellina di Nardò”0.8740.7230.0010.264
Habitat“Leccino”0.0010.0610.0010.256
HabitatXf-infected0.1380.3680.0010.207
HabitatXf-uninfected0.0200.7630.0010.271

